


- © 2004 Canadian Medical Association or its licensors
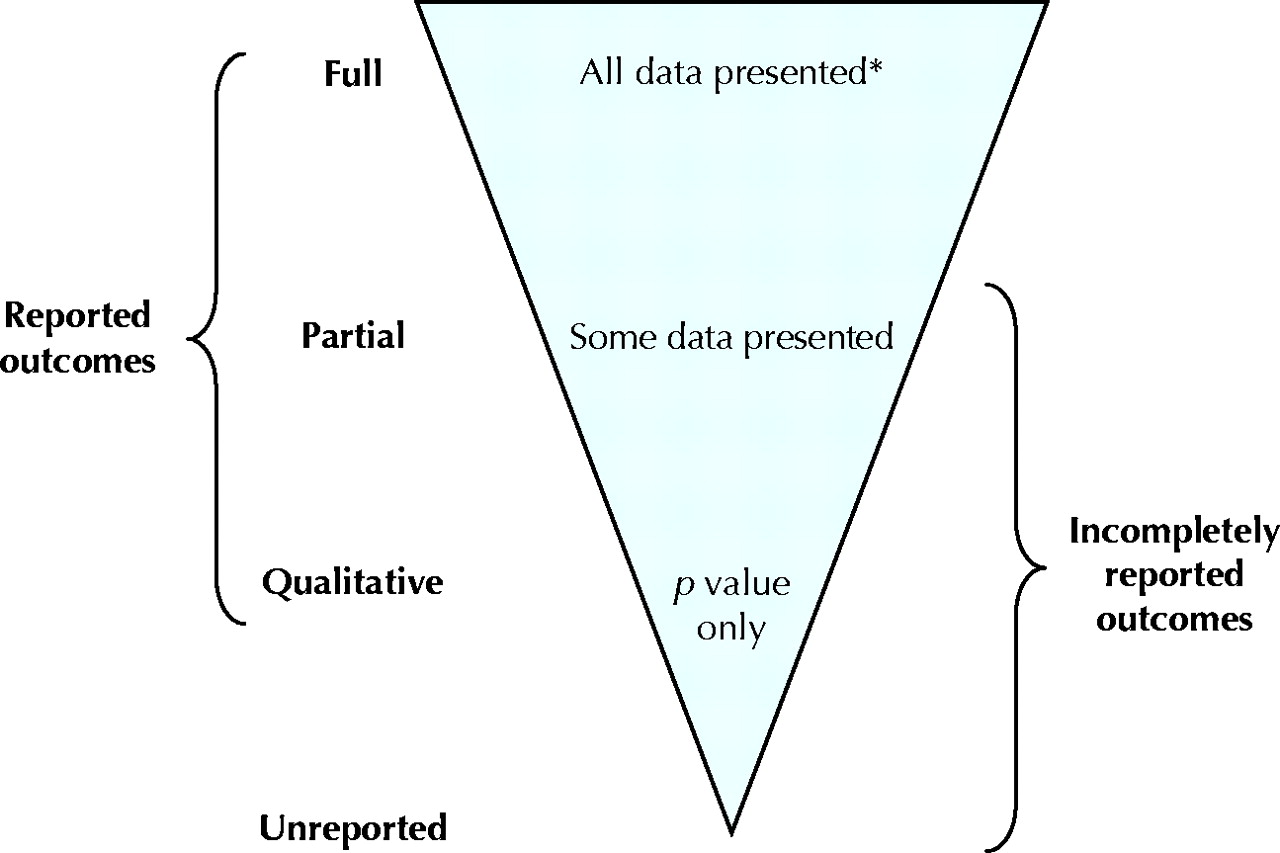
Fig. 1: Hierarchy of the levels of outcome reporting. *See the online appendix (www.cmaj.ca/cgi/content/full/171/7/735/DC1) for descriptions of the amount of data required for meta-analyses of fully reported outcomes
Fig. 2: Identification of published randomized trials approved for funding by the Canadian Institutes of Health Research (formerly the Medical Research Council of Canada) from 1990 to 1998.
- View this table:
Table 1.
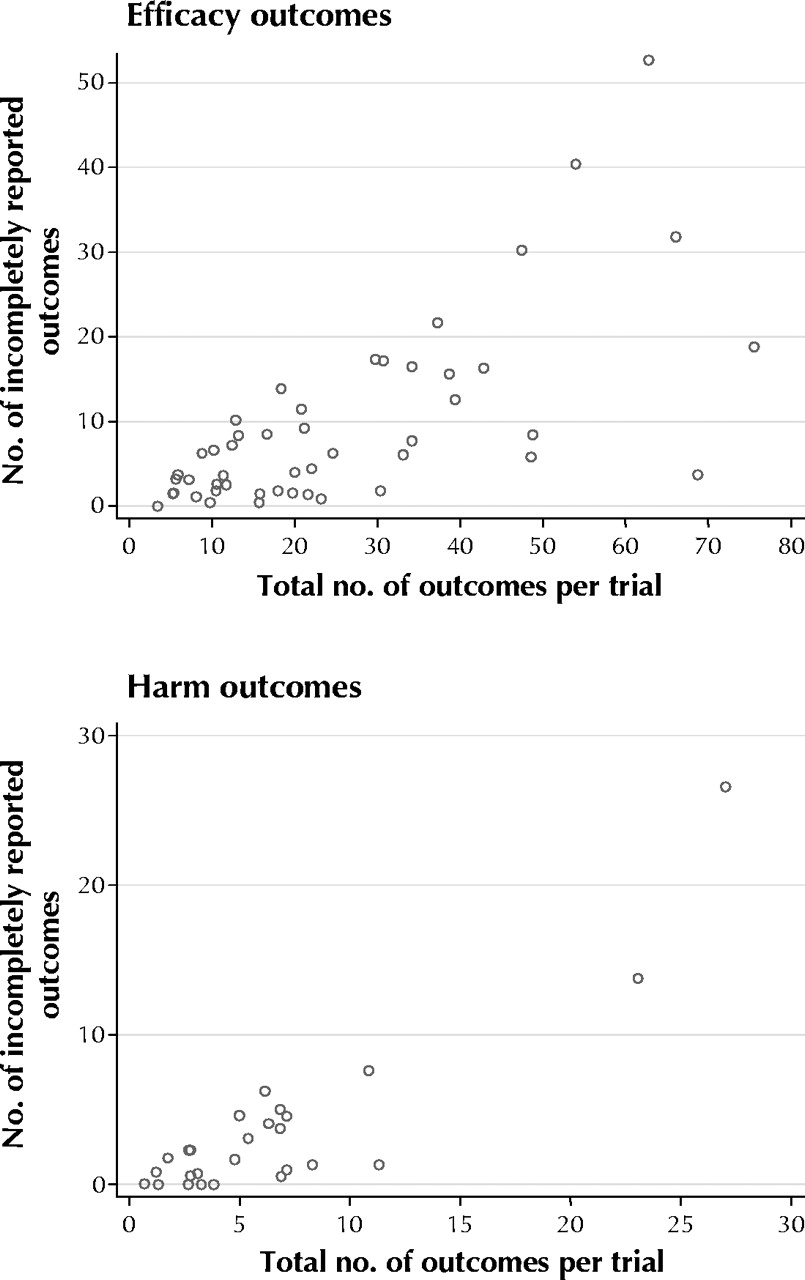
Fig. 3: Number of incompletely reported outcomes per trial, displayed according to total number of outcomes per trial, for outcomes measured to assess the efficacy of an intervention (top panel) and those measured to assess the harm of an intervention (bottom panel).
- View this table:
Table 2.
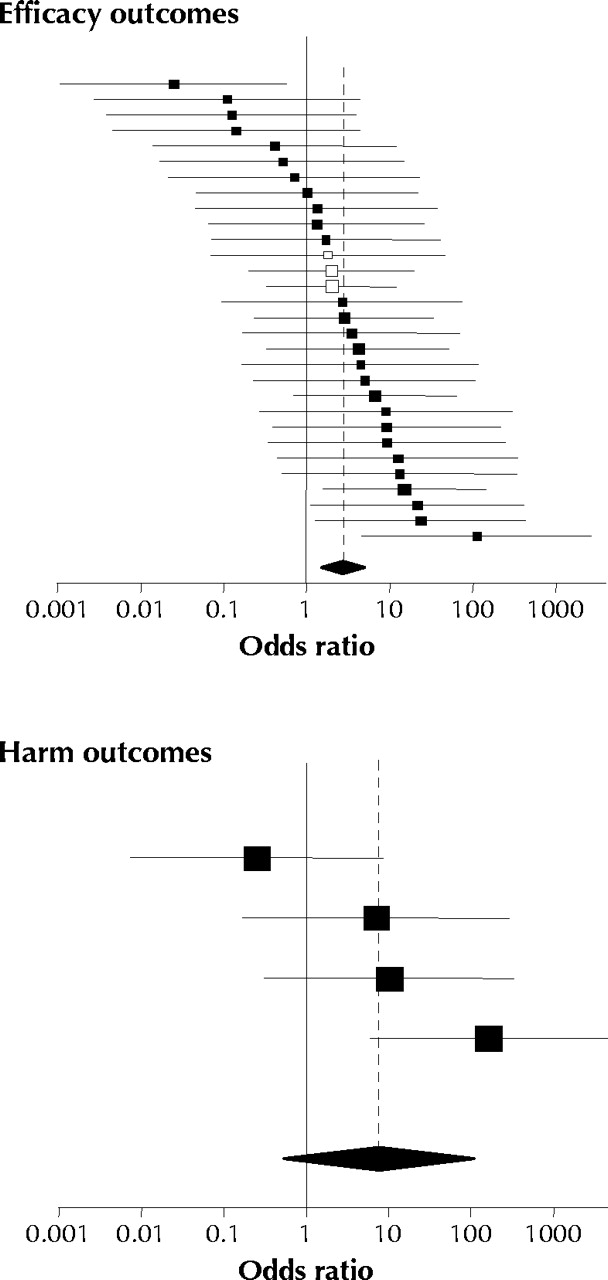
Fig. 4: Odds ratios (squares) and 95% confidence intervals for outcome reporting bias involving efficacy outcomes (30 trials, top panel) and harm outcomes (4 trials, bottom panel). The size of the square reflects the statistical weight of the trial in calculating the pooled odds ratio (represented by the diamond and dotted line).
- View this table:
Table 3.

- © 2004 Canadian Medical Association or its licensors
In this issue

Article tools


Jump to section
Related Articles
Cited By...
- Estimating the prevalence of discrepancies between study registrations and publications: a systematic review and meta-analyses
- Exploring the similarities and differences of variables collected by burn registers globally: protocol for a data dictionary review study
- Catalogue of bias: selective outcome reporting bias
- Key Principles for Conducting a Good Randomized Controlled Trial
- From registration, protocol to report: are COVID-19-related RCTs in mainland China consistent? A systematic review of clinical trial registry and literature
- Restoring invisible and abandoned trials of gabapentin for neuropathic pain: a clinical and methodological investigation
- Publication Rate and Consistency of Registered Trials of Motor-Based Stroke Rehabilitation
- Outcome Reporting bias in Exercise Oncology trials (OREO): a cross-sectional study
- A guide to prospective meta-analysis
- Prompt closure versus gradual weaning of extraventricular drainage for hydrocephalus in adult patients with aneurysmal subarachnoid haemorrhage: a systematic review protocol with meta-analysis and trial sequential analysis
- Compromising Outcomes
- Systematic review of clinical outcome reporting in randomised controlled trials of burn care
- Quality of reporting of outcomes in trials of therapeutic interventions for pressure ulcers in adults: a protocol for a systematic survey
- Research waste is still a scandal--an essay by Paul Glasziou and Iain Chalmers
- Sackler Colloquium on Improving the Reproducibility of Scientific Research: Enhancing primary reports of randomized controlled trials: Three most common challenges and suggested solutions
- Characteristics of Randomized Trials Focusing on Stroke due to Intracerebral Hemorrhage: Systematic Review
- Canadian funders and institutions are lagging on reporting results of clinical trials
- Publication of interventional phase 3 and 4 clinical trials in radiation oncology: an observational study
- Are outcomes reported in surgical randomized trials patient-important? A systematic review and meta-analysis
- State of reporting of primary biomedical research: a scoping review protocol
- Feasibility study to examine discrepancy rates in prespecified and reported outcomes in articles submitted to The BMJ
- Comparison of Registered and Published Primary Outcomes in Randomized Controlled Trials of Orthopaedic Surgical Interventions
- From Protocols to Publications: A Study in Selective Reporting of Outcomes in Randomized Trials in Oncology
- Preferred reporting items for systematic review and meta-analysis protocols (PRISMA-P) 2015: elaboration and explanation
- Completeness of main outcomes across randomized trials in entire discipline: survey of chronic lung disease outcomes in preterm infants
- Selective reporting bias of harm outcomes within studies: findings from a cohort of systematic reviews
- Non-publication and delayed publication of randomized trials on vaccines: survey
- Non-publication of large randomized clinical trials: cross sectional analysis
- "Hardly worth the effort"? Medical journals' policies and their editors' and publishers' views on trial registration and publication bias: quantitative and qualitative study
- US studies may overestimate effect sizes in softer research
- Practices and impact of primary outcome adjustment in randomized controlled trials: meta-epidemiologic study
- SPIRIT 2013 explanation and elaboration: guidance for protocols of clinical trials
- Many Randomized Trials of Physical Therapy Interventions Are Not Adequately Registered: A Survey of 200 Published Trials
- Conflict of interest policies and disclosure requirements among European Society of Cardiology national cardiovascular journals
- Consistency in the Analysis and Reporting of Primary End Points in Oncology Randomized Controlled Trials From Registration to Publication: A Systematic Review
- Multiplicity of data in trial reports and the reliability of meta-analyses: empirical study
- Frequency and reasons for outcome reporting bias in clinical trials: interviews with trialists
- Publication of NIH funded trials registered in ClinicalTrials.gov: cross sectional analysis
- Effect of reporting bias on meta-analyses of drug trials: reanalysis of meta-analyses
- Is best interests a relevant decision making standard for enrolling non-capacitated subjects into clinical research?
- STAR*D: A Tale and Trail of Bias
- Modified intention to treat reporting in randomised controlled trials: systematic review
- CONSORT 2010 Explanation and Elaboration: updated guidelines for reporting parallel group randomised trials
- The PRISMA statement for reporting systematic reviews and meta-analyses of studies that evaluate healthcare interventions: explanation and elaboration
- Undisclosed Changes in Outcomes in Randomized Controlled Trials: An Observational Study
- Integration of evidence from multiple meta-analyses: a primer on umbrella reviews, treatment networks and multiple treatments meta-analyses
- The tyranny of power: is there a better way to calculate sample size?
- Reprint--Preferred Reporting Items for Systematic Reviews and Meta-Analyses: The PRISMA Statement
- Preferred reporting items for systematic reviews and meta-analyses: the PRISMA statement
- Reporting and interpretation of SF-36 outcomes in randomised trials: systematic review
- Discrepancies in sample size calculations and data analyses reported in randomised trials: comparison of publications with protocols
- Empirical evidence of bias in treatment effect estimates in controlled trials with different interventions and outcomes: meta-epidemiological study
- Reporting of radiographic methods in randomised controlled trials assessing structural outcomes in rheumatoid arthritis
- The appropriateness of asymmetry tests for publication bias in meta-analyses: a large survey
- Oral presentation bias: a retrospective cohort study
- Clinical trial registration at Tobacco Control
- Believability of relative risks and odds ratios in abstracts: cross sectional study
- Waiving confidentiality for the greater good
- Comparison of descriptions of allocation concealment in trial protocols and the published reports: cohort study
- Principles for international registration of protocol information and results from human trials of health related interventions: Ottawa statement (part 1)
- Conduct and Reporting of Clinical Research
- Identifying outcome reporting bias in randomised trials on PubMed: review of publications and survey of authors
- Outcome reporting bias in government-funded RCTs
- Outcome reporting bias in government-funded RCTs
- Trial protocols at the BMJ
- The Cochrane Collaboration at 10: kudos and challenges
- La Cochrane Collaboration a 10 ans : realisations et defis
- Registering CIHR-funded randomized controlled trials: a global public good
More in this TOC Section
Similar Articles
Collections

