


- View this table:
Table 1.
- View this table:
Table 2.
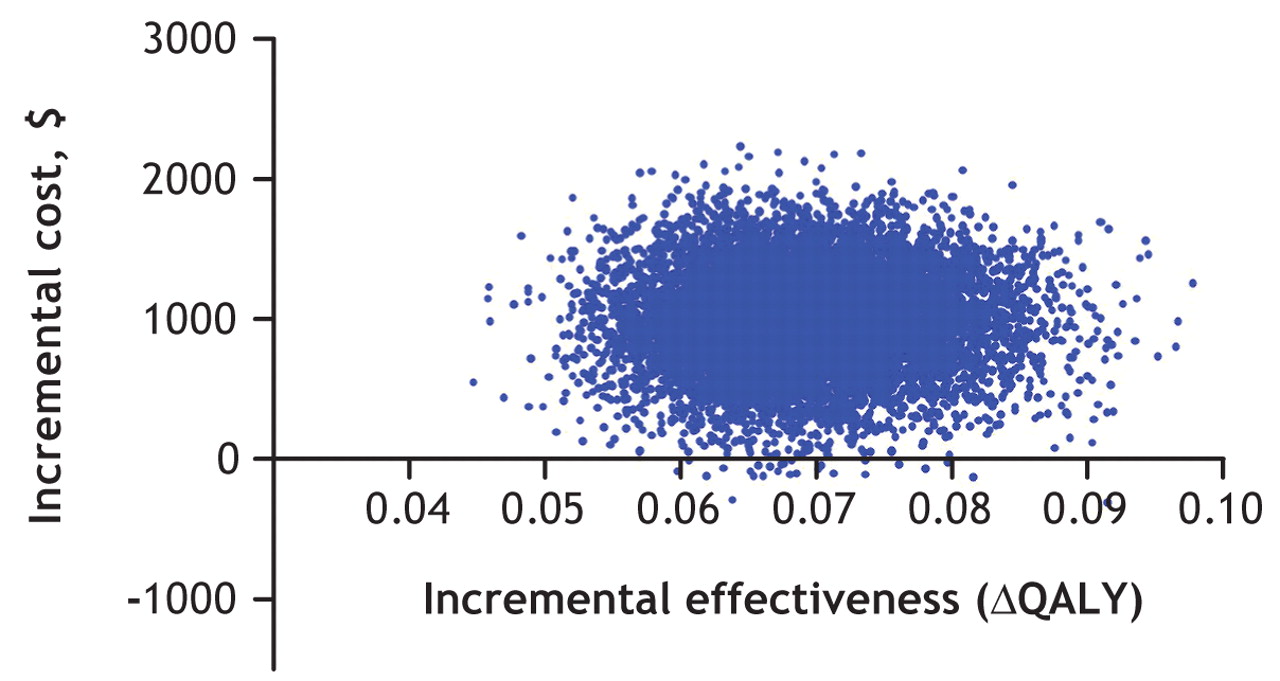
Fig. 1: Joint density of the incremental costs and benefits of each of the 20 000 simulated cost-effectiveness ratios.
Fig. 2: Cost-effectiveness acceptability curve of maximum willingness to pay for self-managed anticoagulation therapy versus physician-managed anticoagulation therapy.

In this issue

Article tools
Respond to this article


Jump to section
Related Articles
Cited By...
- American Society of Hematology 2018 guidelines for management of venous thromboembolism: optimal management of anticoagulation therapy
- Is self-monitoring an effective option for people receiving long-term vitamin K antagonist therapy? A systematic review and economic evaluation
- Self-monitoring of oral anticoagulation reduces thromboembolic events and does not increase risk of bleeding in selected patients and settings
- Patient self-management of warfarin therapy: Pragmatic feasibility study in Canadian primary care
- From Tasks To Processes: The Case For Changing Health Information Technology To Improve Health Care
- Self-managed oral anticoagulation therapy
- Self-managed oral anticoagulation therapy
More in this TOC Section
Similar Articles
Collections

