


Compared with the other Group of 10 (G10) countries, Canada performed better than most in terms of percentage of the population receiving 2 doses of a SARS-CoV-2 vaccine, and on measures assessing the direct effect of the pandemic: number of people infected, number who died from COVID-19 and total excess deaths.
People in Canada experienced some of the most restrictive public health measures across a broad range of domains, including restrictions on public gatherings and school closures.
Canada’s economy showed similar growth in inflation and public indebtedness, but weaker gross domestic product growth than other countries.
As Canada enters the third year of the pandemic, government and public health leaders should inform the public about the nation’s successes and ongoing challenges, shape expectations regarding pandemic control measures that may be necessary in the months ahead, and focus public health restrictions on those that remain essential to contain spread of SARS-CoV-2 infection.
The first known diagnosis of SARS-CoV-2 infection in Canada was in a patient in hospital in Toronto on Jan. 25, 2020.1 At the time, few anticipated the intensity and duration of the COVID-19 pandemic, which has presented health systems and governments globally with challenges not encountered in a century. Through the first 2 years of the pandemic, the Canadian public bore the substantial burden of a range of public health measures, while maintaining a high degree of social solidarity with respect to policies such as the need for vaccines.2 As the pandemic continues into its third year, a reflection on how Canada compared with similar nations during the first 2 years of the pandemic may allow both the public and our governments to better contextualize Canada’s response to and experience of the pandemic. We consider how Canada compared with peer nations on several broad indicators that reflect the impact of both SARS-CoV-2 and measures to contain it, using publicly available data.
How can we compare Canada with other countries?
We sought to compare Canada’s rates of SARS-CoV-2 infection, COVID-19–related and all-cause excess deaths, SARS-CoV-2 vaccination rates, pandemic-related societal restrictions and economic impacts of the pandemic with those of similar countries (see Box 1 for our rationale for metrics used in this analysis). We used data from Feb. 4, 2020, to Feb. 8, 2022, from several international data repositories: Our World in Data; the Organisation for Economic Co-operation and Development (OECD); the United Nations Educational, Scientific and Cultural Organization (UNESCO); and the International Monetary Fund.14–17
Rationale for metrics used in the analysis
SARS-CoV-2 infections: The reported number of people infected with SARS-CoV-2 is useful for estimating work and school absences, and the potential long-term disruption to family life, work and education owing to persistent postviral chronic symptoms (long COVID).3 Depending on vaccination status and baseline immunity from previous infection, a certain proportion of cases will lead to hospital admissions and deaths.
COVID-19–related deaths reflect the most severe spectrum of disease and are related in part to health system responsiveness and capacity, and also capture outbreaks in particularly vulnerable sectors.4 Deaths related to COVID-19 have been undercounted worldwide, including in higher-income settings such as Canada.5,6
Excess deaths are less prone to misclassification and capture both deaths related to COVID-19 and those attributable to health care system disruptions (e.g., delayed cancer surgeries) and societal disruptions (e.g., substance use).7 They also capture indirect “beneficial” effects, such as decreased mortality owing to fewer motor vehicle deaths during lockdowns (Appendix 1, Supplementary Methods 1, available at www.cmaj.ca/lookup/doi/10.1503/cmaj.220316/tab-related-content).8
Percentage of the population vaccinated reflects a country’s ability to procure vaccines and the logistics of distribution. Unfortunately, although some publicly available data address broad demographics such as age and sex, these sources do not provide information that would enable detailed comparisons of vaccine equity; e.g., race, neighbourhood income quintile, educational background or employment-related exposure risk.9,10
Societal restrictions refer to jurisdictions’ nonpharmacologic public health measures imposed to limit viral spread. We used the Oxford Stringency Index,11 a widely applied tracking measure that includes school, workplace and public transport closures; cancellation of public events; restrictions on public gatherings; stay-at-home requirements; public information campaigns; restrictions on internal movements; and international travel controls (Appendix 1, Supplementary Methods 2). We examined the median stringency by country, and the number of days at extremes (days above the 90th percentile or below the 10th percentile of all Group of 10 countries). We additionally considered full and partial closures of primary and secondary schools.
Economic impact can be measured using a diverse range of indicators.12 We examined 4 indicators: unemployment, which also has individual-level negative health impacts;13 gross domestic product (GDP) per capita; inflation rate; and the ratio of general government gross debt to GDP.
We applied 3 criteria to choose comparator countries. First, similarity in economic and political models, given the policy and governance challenges of implementing public health restrictions in democracies, especially policies that affect personal liberty. Second, we considered similar per-capita income levels to be important, given this metric’s correlation with health system capacity, which is critical to pandemic response and is in turn relevant for factors such as public health infrastructure to implement screening and vaccination, and hospital- and intensive care unit–based care for those with severe disease. Lastly, we considered population size, to a certain extent, given the logistics of population-wide pandemic management. We sought the largest defined grouping of countries that existed in prepandemic times that would fulfill these criteria. Given these considerations, we chose to compare the Group of 10 (G10) countries: Canada, Belgium, France, Germany, Italy, Japan, the Netherlands, Sweden, Switzerland, the United Kingdom and the United States (11 countries in total).
We decided against other comparator groupings, such as countries with a high Human Development Index, because they included countries with very small populations (e.g., Iceland, population 371 000);18 larger groupings such as the Group of 20 and OECD, which include World Bank Lower-Middle Income countries (e.g., India); and countries with substantially different political systems (e.g., Saudi Arabia, an absolute monarchy).14,19 Group of 7 (G7) countries also fulfill the criteria we outlined, but the G10 provided more comparators (and includes all G7 countries). We are not aware of another widely used prepandemic grouping of countries that would provide a larger number of comparator countries for Canada, while having all countries meet the 3 criteria outlined. Nonetheless, as a sensitivity analysis, we calculated key figures for the European Union and the OECD countries.
We intentionally avoided choosing or excluding specific comparator countries, so as not to introduce directional bias. For example, 2 countries with a population size similar to Canada that are World Bank High-Income Economies, which we could have considered, include New Zealand and Croatia. The former has one of the lowest COVID-19–related cumulative death rates of 10 per million, while the latter has one of the highest, at 3400 per million (comparison made in February 2022 from Our World in Data). Intentional inclusion of either country as a comparator would result in Canada appearing either worse or better in terms of death rates.
How has Canada fared compared with other countries?
COVID-19 cases
Canada’s cumulative per-capita rate of COVID-19 cases was 82 700 per million, with all comparator countries (except Japan) above 100 000 per million and most countries at least two- to threefold higher than Canada. The Netherlands and France had the highest cumulative per-capita rates (313 000/million and 312 000/million, respectively), and Japan the lowest, at 27 600 per million (Figure 1A).
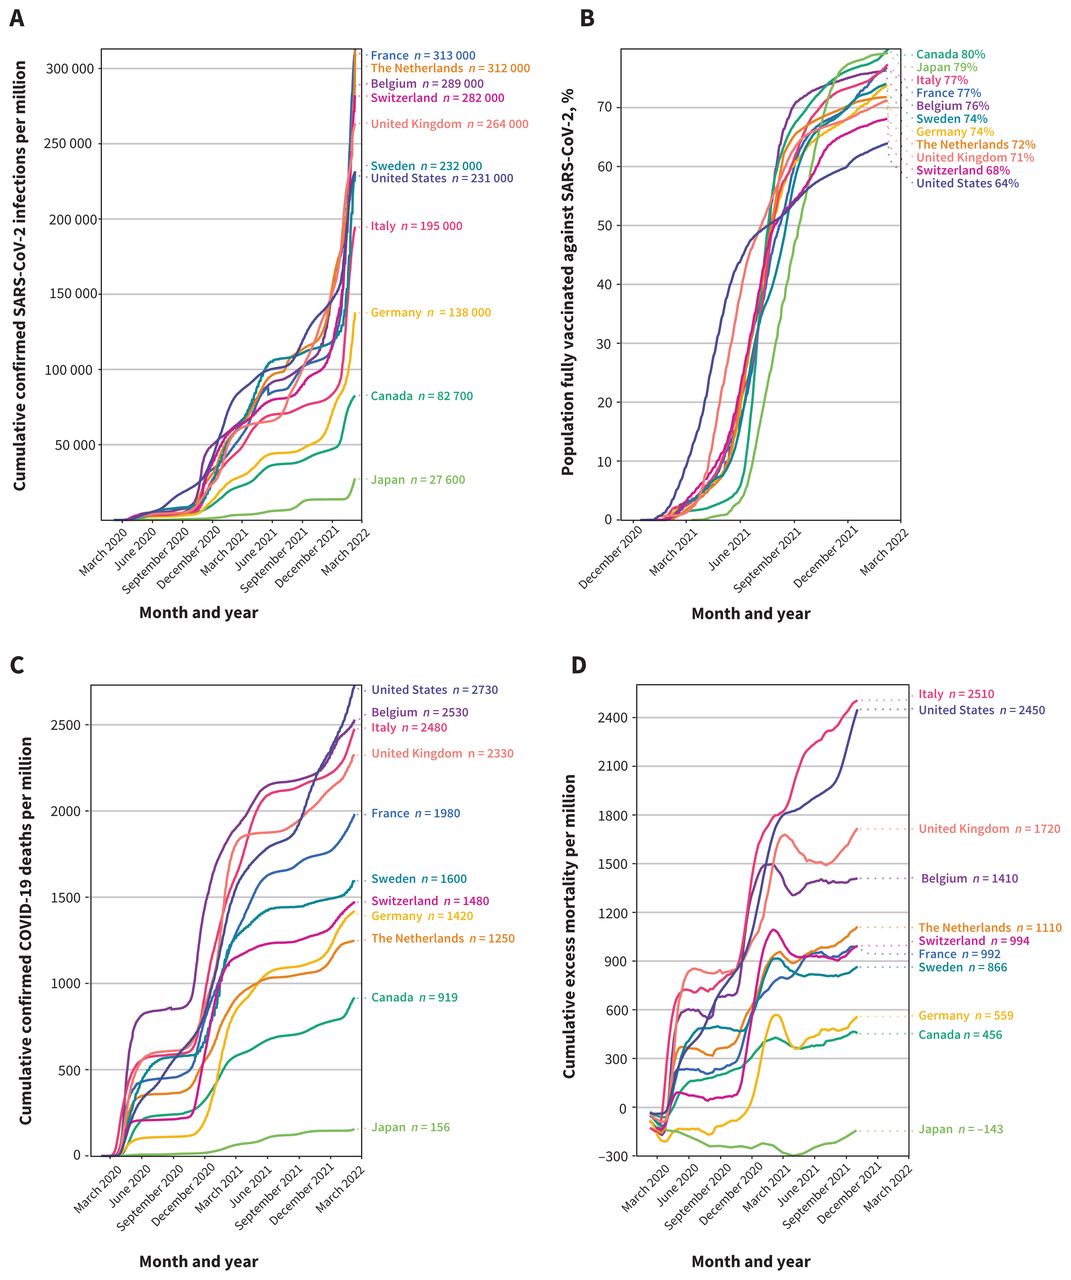
SARS-CoV-2 infections, vaccination status, COVID-19 deaths and excess deaths. Data were extracted from a publicly available source (Our World in Data). We analyzed country-level data on the daily cumulative numbers per 1 million population for confirmed SARS-CoV-2 infections (A), confirmed COVID-19 deaths (C) and excess deaths (D). Additionally, we retrieved the proportion of population who received all doses of SARS-CoV-2 vaccine prescribed by the initial vaccination protocol (B). Given that the latest data available for Canada on the cumulative excess mortality were from Oct. 3, 2021, we used this date as the cut-off for comparisons against other countries (D).
Vaccination
Canada was among the slowest countries to begin vaccination, but vaccination rates rose rapidly in the second half of 2021. As of February 2022, Canada had the highest proportion of fully vaccinated people (i.e., those who received all doses as per original vaccine protocol, typically 2 doses in the countries examined) at 79.9%, slightly ahead of Japan (Figure 1B). The US had the lowest proportion of fully vaccinated people at 63.9%, despite having the most rapid initial uptake of vaccines from December 2020 to June 2021. In terms of booster doses, Italy had the highest proportion at 58.8%, Japan the lowest (7.3%) and Canada was around the midpoint (43.1%; Appendix 1, Supplement Figure 1, available at www.cmaj.ca/lookup/doi/10.1503/cmaj.220316/tab-related-content).
COVID-19–related deaths
Canada’s rate of COVID-19–related deaths was 919 per million, second lowest compared with Japan (156/million); all other countries were over 1000 per million (Figure 1C). The US had the highest number of cumulative COVID-19–related deaths at 2730 per million. Cumulative excess mortality (Figure 1D) was lowest in Japan (−143/million; i.e., a lower death rate than projected), second lowest in Canada (456/million) and highest in Italy (2510/ million) and the US (2450/million).
Social and public health restrictions
Canada had the second-highest median Oxford Stringency Index (70.8), had the narrowest variation in stringency level over the pandemic (interquartile range 67.1 to 73.6; Figure 2), and was middle of the group in terms of days above the 90th percentile (26 d) and below the 10th percentile (50 d). Italy had the highest median stringency level over the pandemic (71.3), the greatest number of days at stringency above the 90th percentile (267 d), and the fewest numbers of days below the 10th percentile (23 d) (Figure 2). Japan had the lowest median stringency (47.2), 0 days over the 90th percentile and the most days below the 10th percentile (230 d).

Oxford Stringency Index. In the box-and-whisker plot (A), we calculated the country-specific percentiles of stringency index. In the bar graphs, we first calculated the Group of 10 (G10) 10th and 90th percentiles (37.0 and 76.8, respectively) of Stringency Index based on all available daily reports of Stringency Index from all 11 countries included in the analysis since the start of the pandemic to Feb. 8, 2022. We then obtained the number of days that each country was either (B) above the G10 90th percentile or (C) below the G10 10th percentile.
Canada had the second longest duration of primary and secondary school closures at 51 weeks (Appendix 1, Supplement Figure 2). The US had the highest number of weeks of full and partial school closures (66 wk), and Switzerland had the lowest (6 wk).
When all 9 components of the Oxford Stringency Index were disaggregated, Canada had among the most sustained stringent policies regarding restrictions on internal movement, cancellation of public events, restrictions on public gatherings, workplace closures and international travel controls (Appendix 1, Supplement Figure 3). Canada was the only country in the G10 that maintained a sustained moderate (> 40th percentile) to severe degree of restriction from spring 2020 onward (Appendix 1, Supplement Figure 4).
Economic metrics
Canada and the US both had notable surges in unemployment coinciding with the first wave of the pandemic, respectively peaking at 13.4% (May 2020) and 14.7% (April 2020) (Appendix 1, Supplement Figure 5). Most countries have returned to prepandemic unemployment rates (comparing December 2019 with December 2021), with the largest difference in Sweden (+1.0% unemployed, Figure 3A). The pace of recovery from the COVID-19 economic shock differed across countries. Although Sweden surpassed the pre–COVID-19 gross domestic product (GDP) level by 2.8%, Canada reported a decrease of 1.6% (Figure 3B). Canada was at the midpoint of countries for increase in inflation rate at 2.6%; the greatest increase occurred in Belgium (5.0%), the lowest in Japan (0%) (Figure 3C). All countries had a positive inflation rate, with Canada around the midpoint at 4.8%, and a range from 0.8% in Japan to 7% in the US (Appendix 1, Supplement Figure 6). Canada’s increase in debt-to-GDP ratio was relatively high at 23.1% (Figure 3D); the increase was highest in the US (24.8%) and the lowest in Switzerland (2.9%). However, Canada’s debt-to-GDP ratio in 2021 (110) was at the midpoint of countries (Appendix 1, Supplement Figure 7).

Change in (A) unemployment rate, (B) gross domestic product (GDP) per capita and (C) inflation. Using quarterly data from the Organisation for Economic Co-operation and Development (OECD), we extracted the unemployment rates, GDP per capita (US dollars, volume estimates, fixed purchasing power parity, OECD reference year 2015, and seasonally adjusted), and annual inflation measured by consumer price index from the fourth quarter of 2019 (Q4–2019) to Q4–2021. We calculated the change in unemployment rates for each country by taking the difference between Q4–2021 and Q4–2019 (A). We obtained change in GDP per capita by taking the difference between the 2 GDP per capita, divided by the baseline GDP per capita (Q4–2019 [B]). We obtained the change in inflation rate by taking the difference between December 2021 and December 2019 (C). Additionally, using annual data from the International Monetary Fund, we obtained annual general government gross debt (percentage of GDP) from years 2019 to 2021. We calculated change in debt-to-GDP ratio by taking the difference between year 2021 and year 2019 (D).
In our recalculation of Figures 1–⇑3 for the European Union and the OECD countries (as per the sensitivity analysis noted above; see Appendix 1, Supplement Figures 8–10), the relative position of Canada, and interpretation of its performance in relation to other countries, remained essentially unchanged.
What policy lessons can be derived from this analysis?
Reflection on the findings of the analysis
All the measures we reviewed are susceptible to inaccuracies that could affect within-country and country-to-country comparisons, not least testing rates for SARS-CoV-2 and methods used to code cause of death. However, these are the only available routinely collected national-level data for our parameters of interest and would not be expected to systematically bias Canada’s relative position among peer nations. We acknowledge that alternative approaches to calculating excess deaths may result in different country rankings. However, in our sensitivity analysis using the machine-learning model developed by The Economist magazine,7 the relative ranking of countries was almost the same, although absolute numbers were somewhat different (Appendix 1, Supplement Table 1).
We deliberately do not draw firm causal conclusions regarding the relationship of interventions and outcomes in our comparison between Canada and similar nations. The risk of misinferences owing to the ecological fallacy is high, as highlighted by the post-publication review and reanalysis of a recent high-profile ecological analysis that claimed the proportion of the population vaccinated was unrelated to subsequent COVID-19 cases.20–24 In addition, national-level reporting does not consider subnational variation, which is important in countries such as Canada, given the provincial responsibility for health care delivery. For example, a review of excess mortality and COVID-19–related mortality across Canadian provinces showed substantial variation and, in some cases, poor alignment between these 2 measures.25 Finally, surges of cases and deaths do not occur simultaneously across countries, likely requiring the pandemic to run its full course before stronger inferences about causes and effects can be drawn.26
Our review of a broad range of metrics related to pandemic control and outcomes across G10 nations does, however, provide a stark picture of the varying approaches taken by governments and the related impact of the virus and mitigating interventions over the course of the pandemic. It is clear that, within the G10, Japan has been an outlier, with extremely low COVID-19 case rates and mortality, despite a comparable percentage of the population vaccinated, the least strict public health measures and the oldest age structure, compared with peer countries. Among the remaining G10 countries, Canada had both the lowest direct burden of infection and the highest overall vaccination rate (Appendix 1, Supplement Table 3). These outcomes occurred despite very low baseline hospital and critical care capacity relative to comparator nations,27 and a relatively small population in relation to geographic size, creating logistical challenges for care delivery.
Broad mitigating strategies, such as restrictions on public gatherings, business closures and school closures, showed a wide degree of variability among countries, with Canada being relatively stringent compared with peer nations. Unfortunately, there are no broadly comparable country-level data on many crucial elements of pandemic control and consequences of this control, such as strategies to reduce disease spread through test–trace–isolate protocols; compliance with control strategies (e.g., adherence to mask mandates); consequences of constrained health system capacity causing delayed health care delivery for non–COVID-19 conditions, such as surgeries;28 and broader impacts on mental health.29
Government debt rose for all countries, with Canada having among the greatest relative increases, albeit from a lower starting point. Although most countries have shown the ability to return to prepandemic employment levels, inflation remains a major challenge.
Comparing Canada against countries with the highest burden in each COVID-19 metric shows how different the pandemic experience could have been for Canadians. If France’s rate of infection had occurred in Canada, for example, in the first 2 years of the pandemic, Canada would have seen about 8.75 million more SARS-CoV-2 infections, with considerable implications for both severe illness and incident long COVID. If the US vaccination rate and COVID-19–related death rate occurred in Canada, about 5.9 million fewer Canadians would have been vaccinated, and about 68 800 more Canadians would have perished from COVID-19.
The reasons for Japan’s outlier status are unknown. At least during the first half of the pandemic, this outcome was not related to stringent public health measures or high vaccination rates, as shown in Figure 1B and Figure 2. We did not account for the age structure of countries in terms of mortality. For example, in Japan, the percentage of the population older than 65 years is 28.4%, compared with 16.6% in the US and 18.1% in Canada. If anything, however, this would magnify Japan’s outlier position.
Several hypotheses have been advanced to explain Japan’s low SARS-CoV-2 burden, including its isolation as an island, higher baseline population immunity from previous coronavirus infections, a homogenous population with highly prevalent genetic human leukocyte antigen haplotype that differs from citizens of other countries, cultural differences in compliance with mask-wearing, and earlier recognition by public health officials of aero-solized virus spread.30–32 Future analyses should consider lessons we can learn from Japan, as well as countries such as New Zealand, which maintained very low COVID-19 burdens through a “Zero-COVID” approach in earlier phases of the pandemic.
Potential lessons
Keeping uncertainties about causation in mind, we can hypothesize that high vaccination percentages and good compliance with sustained public health restrictions explain at least part of Canada’s strong performance in limiting SARS-CoV-2–related health burdens. It will fall to future reviews to judge the balance of benefits and harms associated with Canada’s strategy as contrasted with other jurisdictions, but if that inference is correct, one might also ask how these findings inform next steps in Canada’s pandemic response.
As one example, Canada’s high 2-dose vaccination rates suggest attitudes different from those in the US, where a quarter of the population still expresses sentiments that range from modest hesitancy to outright hostility regarding vaccination.33 The relatively low uptake of booster shots in Canada might accordingly be improved if governments and public health leaders provide more and clearer information about the protective effect of boosters, and if innovative programs focused on lower-income and racialized groups — programs that were a cornerstone of Canada’s initial vaccination successes — are maintained for booster roll-out.34 At the same time, given the diminishing marginal effects of fourth shots of current vaccines on infection risks for people who are not immunocompromised, Canadian political and public health leaders must be transparent about the yield of further boosters and openly acknowledge the urgent need and ongoing quest for new vaccine formulations.
Another lesson relates to public health restrictions. Restrictions have a time-varying relationship with pandemic burden that is difficult to quantify with cumulative point estimates. However, given the timing of Canadian access to vaccines, the beneficial effects of collective public health measures likely contributed to positive outcomes in the first pandemic year at a minimum. That said, Canada had the second-longest duration of school closures and some of the strictest restrictions and bans on public gatherings in the G10. Adjustment of future public health measures appears timely, given growing background immunity, the need to enable continued function of key elements of civil society and evidence that support by the Canadian public for collective restrictive measures is waning.35 Looking back, as evidence emerged of the predominantly airborne spread of SARS-CoV-2,36 could earlier consideration have been given to keeping schools open and maintaining safe public gatherings through greater investments in air filtration and adequate ventilation? Looking ahead, given emerging evidence of the continued beneficial effects of mask-wearing, might maintaining a requirement for masks in indoor public settings during periods of high viral spread be wise?37
Canada was also among the strictest countries in limiting international and domestic travel. Initially defensible under the precautionary principle, these measures proved ineffective given globalization and a highly contagious pathogen like SARS-CoV-2. For example, although the Omicron surge triggered stringent restrictions against travellers from South Africa and surrounding countries, subsequent evidence showed that the variant was detectable in Europe a week before South Africa even reported its first case.38 Return to normalcy for Canadians requires judicious use of mitigating strategies such as border controls, with prompt removal of restrictions when found not to be effective.
It is important to note that the time frame of our analysis does not include Omicron waves, which have created new challenges with accelerated infection rates causing considerable disruption.39,40 The full effect of this variant and its subvariants will require a thorough retrospective analysis. Unfortunately, severe limits in testing capacity, and potential Omicron reinfections, will make percapita case rates harder to interpret because many individuals will be missed even as others could be counted twice. SARS-CoV-2 case rates during and after the Omicron waves may therefore no longer be comparable within and between countries. Notably, compared with G10 countries, since January 2022, Canada has the second-lowest rate of polymerase chain reaction (PCR) testing per capita (Appendix 1, Supplement Table 2), even as the Omicron waves may have resulted in more than 40% of the Canadian population being infected.41 This lack of testing impedes infection control, recognition of outbreaks, the use of potential prophylactic therapies, tracking of variants of concern and delineation of at-risk groups for post–COVID-19 sequelae. Alternative strategies for population-level estimates of infection burden, such as serology, wastewater testing or workplace- and hospital-based screening, may inform future analyses, but are not currently considered an adequate replacement for individual-level PCR testing.42
Conclusion
Canada’s record thus far in responding to the COVID-19 pandemic compares favourably to most comparator nations for broad health outcomes, although adverse economic and social impacts are also apparent. As the country continues through subsequent phases of the pandemic, careful collection and analysis of data are necessary, while acknowledging the limits of available indicators and comparisons. Leaders should share new findings with the public transparently and swiftly, and make strategic adjustments to reinforce measures that appear to be successful and to modify others as appropriate.
Acknowledgement
The authors thank Professor Michael Krashinsky for reviewing this manuscript and providing advice on choice and evaluation of economic parameters.
Footnotes
Competing interests: Fahad Razak is Scientific Director and Arthur Slutsky is a member of the Ontario COVID-19 Science Advisory Table. Fahad Razak reports holding a salary award as the Graham Farquharson Knowledge Translation Fellow from the PSI Foundation and is an employee of Ontario Health and Public Health Ontario. Dr. Razak has also received grants (outside the current article) to study COVID-19 from the Canadian Institute of Health Research, Canadian Frailty Network, the University of Toronto (including the Department of Medicine, St. Michael’s Hospital and the Sunnybrook Health Sciences Centre), the Digital Research Alliance of Canada (Data Champions Pilot Project) and the Royal College of Physicians and Surgeons of Canada. David Naylor is volunteer Co-Chair of Canada’s COVID-19 Immunity Task Force, a federally funded and mandated group. Dr. Naylor reports receiving salary support from the Department of Medicine, University of Toronto. Arthur Slutsky is Chair of the International ECMO Network. Dr. Slutsky reports receiving consulting fees regarding the development of drugs to treat COVID-19 from Altimmune, Apeiron, GSK, Cellenkos, Edesa, Exvastat and Translate Bio. Dr. Slutsky also reports membership of safety committees in relation to treatments for COVID-19, from Diffusion Pharmaceuticals and Faron. No other competing interests were declared.
This article has been peer reviewed.
Contributors: Fahad Razak, David Naylor and Arthur Slutsky conceived and designed the study. All authors contributed to data interpretation. Saeha Shin was responsible for acquiring data and for all analyses presented in this study. Fahad Razak drafted the manuscript and all authors revised it for important intellectual content, gave final approval of the version to be published and agreed to be accountable for all aspects of the work. David Naylor and Arthur Slutsky contributed equally and are co–senior authors.
Data sharing: All data used in this analysis are from publicly available websites and can be directly accessed with no user fees.
This is an Open Access article distributed in accordance with the terms of the Creative Commons Attribution (CC BY-NC-ND 4.0) licence, which permits use, distribution and reproduction in any medium, provided that the original publication is properly cited, the use is noncommercial (i.e., research or educational use), and no modifications or adaptations are made. See: https://creativecommons.org/licenses/by-nc-nd/4.0/
In this issue

Article extras
Article tools


Jump to section
Related Articles
Cited By...
- Physicians perspectives on COVID-19 vaccinations for children: a qualitative exploration in Ontario, Canada
- Hybrid immunity from SARS-CoV-2 infection and vaccination in Canadian adults: cohort study
- The world expected more of Canada
- Use and misuse of research: Canadas response to covid-19 and its health inequalities
- Characterizing responsiveness to the COVID-19 pandemic in the United States and Canada using mobility data
- Which curve are we flattening? The disproportionate impact of COVID-19 among economically marginalized communities in Ontario, Canada, was unchanged from wild-type to omicron
- Relative Pandemic Severity in Canada and Four Peer Nations During the SARS-CoV-2 Pandemic
- Correction to "Canadas response to the initial 2 years of the COVID-19 pandemic: a comparison with peer countries"
- Covid-19: Canada outperformed comparable nations in pandemic response, study reports
More in this TOC Section
Similar Articles
Collections

