


Abstract
BACKGROUND: Physical-distancing interventions are being used in Canada to slow the spread of severe acute respiratory syndrome coronavirus 2, but it is not clear how effective they will be. We evaluated how different nonpharmaceutical interventions could be used to control the coronavirus disease 2019 (COVID-19) pandemic and reduce the burden on the health care system.
METHODS: We used an age-structured compartmental model of COVID-19 transmission in the population of Ontario, Canada. We compared a base case with limited testing, isolation and quarantine to scenarios with the following: enhanced case finding, restrictive physical-distancing measures, or a combination of enhanced case finding and less restrictive physical distancing. Interventions were either implemented for fixed durations or dynamically cycled on and off, based on projected occupancy of intensive care unit (ICU) beds. We present medians and credible intervals from 100 replicates per scenario using a 2-year time horizon.
RESULTS: We estimated that 56% (95% credible interval 42%–63%) of the Ontario population would be infected over the course of the epidemic in the base case. At the epidemic peak, we projected 107 000 (95% credible interval 60 760–149 000) cases in hospital (non-ICU) and 55 500 (95% credible interval 32 700–75 200) cases in ICU. For fixed-duration scenarios, all interventions were projected to delay and reduce the height of the epidemic peak relative to the base case, with restrictive physical distancing estimated to have the greatest effect. Longer duration interventions were more effective. Dynamic interventions were projected to reduce the proportion of the population infected at the end of the 2-year period and could reduce the median number of cases in ICU below current estimates of Ontario’s ICU capacity.
INTERPRETATION: Without substantial physical distancing or a combination of moderate physical distancing with enhanced case finding, we project that ICU resources would be overwhelmed. Dynamic physical distancing could maintain health-system capacity and also allow periodic psychological and economic respite for populations.
The coronavirus disease 2019 (COVID-19) pandemic represents a global public health emergency unparalleled in recent time. In the 2 months since the initial World Health Organization report describing the COVID-19 outbreak concentrated in Wuhan, China,1 the number of confirmed cases has risen sharply from 282 to more than 330 000, with 14 510 reported deaths across all regions of the globe.2 The first imported case of COVID-19 in Ontario, Canada, was reported on Jan. 25, 2020, and community transmission was first documented on Mar. 1, 2020, in British Columbia, Canada.3
This pathogen represents a substantial challenge for public health, pandemic planning and health care systems. Severe acute respiratory syndrome coronavirus 2 (SARS-CoV-2) is highly transmissible.4–7 It causes moderate to severe clinical outcomes in about 20% of all recognized infected individuals.5,8,9 In the absence of a vaccine, public health responses have focused on the use of nonpharmaceutical interventions.10 These nonpharmaceutical interventions include “case-based” measures such as testing, contact tracing, isolation (of infected cases) and quarantine (of exposed cases); and “non-case-based” measures such as reducing the probability of transmission given an effective contact (e.g., hand hygiene and cough etiquette) and physical-distancing measures to reduce the contact rate in the population. Physical distancing minimizes opportunities for person-to-person transmission of the virus to occur. These physical-distancing measures include some combination of school closure, teleworking, cancellation of group activities and events, and a general overall reduction in community contacts. Although these measures are expected to be effective in reducing transmission of SARS-CoV-2, they are also associated with substantial economic costs and societal disruption.
Epidemiologic models can contribute important insight for public health decision-makers by allowing for the examination of a variety of “what-if” scenarios. The Canadian Pandemic Influenza Plan for the Health Sector (the backbone of which informs COVID-19 pandemic preparedness and response) identifies 2 main objectives for responding to a pandemic: to minimize serious morbidity and mortality, and to minimize societal disruption.11 The overarching goal of pandemic response is to find a combination of nonpharmaceutical interventions that would minimize the number of cases requiring in-patient medical care (e.g., hospital and intensive care unit [ICU] admissions) and deaths, while also minimizing the level of societal disruption. Societal disruption could be reduced by limiting the overall duration that the intervention needs to be in force to achieve the associated reductions in morbidity and mortality. A challenge for pandemic response is that, in a fully susceptible population, although nonpharmaceutical interventions may slow disease transmission while they are in place, once the intervention is lifted (or compliance with the intervention becomes low), the transmission of the pathogen rebounds rapidly.10,12 In the case of COVID-19, it may not be possible to minimize morbidity and mortality, and societal and economic disruption at the same time.
Given these considerations, we used a transmission dynamic model of COVID-19 to explore the potential impact of case-based and non-case-based nonpharmaceutical interventions in the population of Ontario, Canada. Our analysis focuses on identifying strategies that keep the number of projected severe cases (hospital and ICU admissions) within a range that would not overwhelm the Ontario health care system, while also considering the amount of time these interventions would be in place.
Methods
Model overview
We developed an age-structured compartmental model that describes COVID-19 transmission in the province of Ontario, Canada. We used a modified “susceptible-exposed-infectious-recovered” framework that incorporated additional compartments to account for public health interventions, different severities of clinical symptoms and risk of hospital admission. An overview of the model compartments and movements between them is provided in Figure 1, and model equations and additional details are provided in Appendix 1, available at www.cmaj.ca/lookup/suppl/doi:10.1503/cmaj.200476/-/DC1. The model was run for a period of 2 years, and we assumed that recovered individuals remained immune from re-infection for the duration of the epidemic. Individuals remained infectious until they recovered or were admitted to hospital; we did not model transmission within health care settings. For simplicity, we assumed that all deaths occurred in cases requiring intensive care. We included cases in hospital (non-ICU) and requiring intensive care to estimate health care requirements over the course of the epidemic. The model was constructed in R.13

Model structure of COVID-19 transmission. Exposed cases can be either quarantined or not; quarantined cases would represent those who were identified via contact tracing. Cases admitted to hospital are assumed to be no longer infectious to others (owing to recognition of infection) and are included in the model to estimate health care requirements. The model is stratified by age group and presence or absence of comorbidities. Note: ICU = intensive care unit.
Model parameters
The model was stratified by 5-year age groups using 2019 population estimates.14 Contacts within and between age groups were based on the POLYMOD study,15 using contact data specific for the United Kingdom. The model was further stratified by health status to account for differential vulnerability to severe infection among those with underlying health conditions. We obtained comorbidity estimates by age from the Canadian Community Health Survey (CCHS)16 for Ontario and included the following conditions: hypertension, heart disease, asthma, stroke, diabetes and cancer. For younger age groups (< 12 yr), we used estimates from Moran and colleagues.17 A limitation of the CCHS is that it may undersample individuals from socioeconomically disadvantaged populations.
Parameters describing the natural history and clinical course of infection were derived from published studies (Table 1, full details in Appendix 1). The rate of growth of epidemics is governed by reproduction numbers, or the number of secondary infections caused by a primary infectious case. For a pandemic disease, in which prior immunity is absent, the operative reproduction number is referred to as the basic reproduction number (R0).23 To capture variability in transmission, specifically the observation that the basic reproduction number for COVID-19 is overdispersed, with some cases transmitting to many others (superspreader events), while many other cases transmit much less, we have added volatility to the transmission term.24–26 This causes each model run to have a different outcome owing to stochasticity (i.e., random variation between model runs). The model was initiated with 750 prevalent cases (based on 150 reported cases in Ontario on Mar. 19, 2020, and an assumed reporting rate of 20%), that were randomly distributed across the infectious compartments.
Model parameters used in the transmission model*
Interventions
Testing was assumed to move individuals with nonsevere symptoms from the infectious to isolated compartments. Isolated cases were assumed to have reduced transmission compared with nonisolated cases. Physical-distancing measures were assumed to reduce the number of contacts per day across the entire population. Details of parameters that were varied under different interventions are included in Table 2. For the base case, we assumed that there was a degree of testing and isolation occurring and that a proportion of exposed cases were quarantined. We then added in additional control measures: (i) enhanced testing and contact tracing; (ii) restrictive physical-distancing measures; and (iii) a combination of enhanced testing and contract tracing, along with less restrictive physical distancing than in (ii). We considered 2 approaches to implementing interventions: (i) fixed durations and (ii) a dynamic approach with interventions turned on and off based on the number of cases requiring ICU care in the population. When interventions were not implemented, values for physical distancing and enhanced testing and contact tracing returned to base case levels. We focused on ICU capacity, given that this is expected to be the most limited resource during the COVID-19 epidemic. Before the emergence of COVID-19, Ontario had about 2000 ICU beds (0.14 beds per 1000 population), but 90% were occupied by individuals with non-COVID-19 illness. In mid-March 2020, the Ontario government made 300 additional ventilator-associated ICU beds available (for a total of 500 unoccupied beds (0.034 per 1000 population). As such, we used 200 COVID-19 cases in the ICU (across all of Ontario [0.014 per 1000]) as a threshold for turning the intervention on. This value was based on about 40% saturation of available beds, combined with the recognition that there is a lag between cases acquiring infection and requiring intensive care, such that one would expect ICU needs to grow rapidly once initial COVID-19 cases present for care.
Details of model scenarios*
Outputs
Key model outputs included final epidemic attack rates (% of population infected at the end of the 2-year period), prevalence of hospital admissions and ICU use, and deaths. For comparison, we show the maximum and current ICU capacity per 1000 population relative to model projections. For the dynamic-intervention scenarios, we also calculated the amount of time over the 2-year model period during which the intervention was implemented, as a measure of intervention intensity. We present model outputs as medians and credible intervals from 100 model replicates per intervention; 95% credible intervals represent the range of outcomes from the 2.5th to 97.5th percentiles, across all model replicates.
Ethics approval
Because this study involved the use of publicly available aggregate data, approval by a research ethics board was not required.
Results
Base case
In the model base case, with limited testing, isolation and quarantine, we estimated that 56% (95% credible interval 42%–63%) of the Ontario population would be infected over the course of the epidemic. This would include cases of all severities. Attack rates were projected to be highest in those aged 5–14 years (77%, 95% credible interval 63%–83%) and 15–49 years (63%, 95% credible interval 48%–71%). Lower attack rates were projected in individuals aged younger than 5 years (50%, 95% credible interval 37%–58%) and adults aged 50–69 years (47%, 95% credible interval 34%–55%) and 70 years and older (30%, 95% credible interval 21%–36%). An example of the outbreak trajectory across model simulations is presented in Figure 2. At the peak of the epidemic, in the absence of any resource constraints to provide care (i.e., assuming all cases requiring medical care receive it), we projected 107 000 (95% credible interval 60 760–149 000) cases in hospital (non-ICU) and 55 500 (95% credible interval 32 700–75 200) cases in ICU. The high prevalence of cases in ICU reflects the mean length of ICU stay associated with COVID-19 infection in other countries.

Projected COVID-19 epidemic trajectory for the base case model with minimal intervention. Daily incident cases per 1000 population are presented. The line represents the median value of 100 model simulations, and the shaded area indicates the 95% credible interval.
Fixed-duration interventions
All of the interventions considered were projected to delay the epidemic peak and reduce the number of cases requiring ICU care at the peak (Figure 3). The effectiveness of the interventions scaled with intervention duration. For all interventions, when the intervention duration was 6 months or less, there was no appreciable difference on final attack rate. With 12 and 18 months of heightened response measures, the proportion of the population infected at the end of the 2-year period was reduced, and, in some simulations, the prevalence of cases requiring intensive care fell below Ontario’s current capacity for all or part of the period. The largest effect was observed for the restrictive physical-distancing intervention. The combination intervention, with enhanced case detection and less aggressive physical distancing, was projected to substantially reduce attack rates when implemented for 18 months, while enhanced case detection in the absence of physical-distancing measures had a more modest effect, on average. There was substantial variability in model projections, owing to model stochasticity.

Projected intensive care unit (ICU) bed requirements and attack rates for fixed-duration interventions. (A) Prevalent cases requiring intensive care are shown for intervention durations of 1, 3, 6, 12 and 18 months. Maximum and current ICU capacity in Ontario are indicated by the dashed horizontal lines. Median values are presented. (B) Model-projected percentage of the population infected over the 2-year period. Attack rates include all infections, regardless of severity. Note that the slight variability in epidemic size for the base case (with no additional intervention) reflects model stochasticity across simulations. More extreme durations of physical distancing create the possibility of stochastic extinction (“die out”) of the disease.
Dynamic interventions
We also explored dynamic interventions that were turned on and off in response to the current state of the epidemic. Dynamic interventions were projected to be effective for reducing the proportion of the population infected at the end of the 2-year period, with potentially shorter durations of physical distancing than the fixed-duration approach (Figure 4). For example, when implemented dynamically, 13 months of physical distancing, cycled on and off, reduced the median overall attack rate to 2%. For the physical distancing alone and combination intervention scenarios, we observed atypical epidemic curves, with the number of cases increasing and decreasing repeatedly over time. In these scenarios, the median number of cases in ICU was reduced below current estimates of Ontario’s ICU capacity.
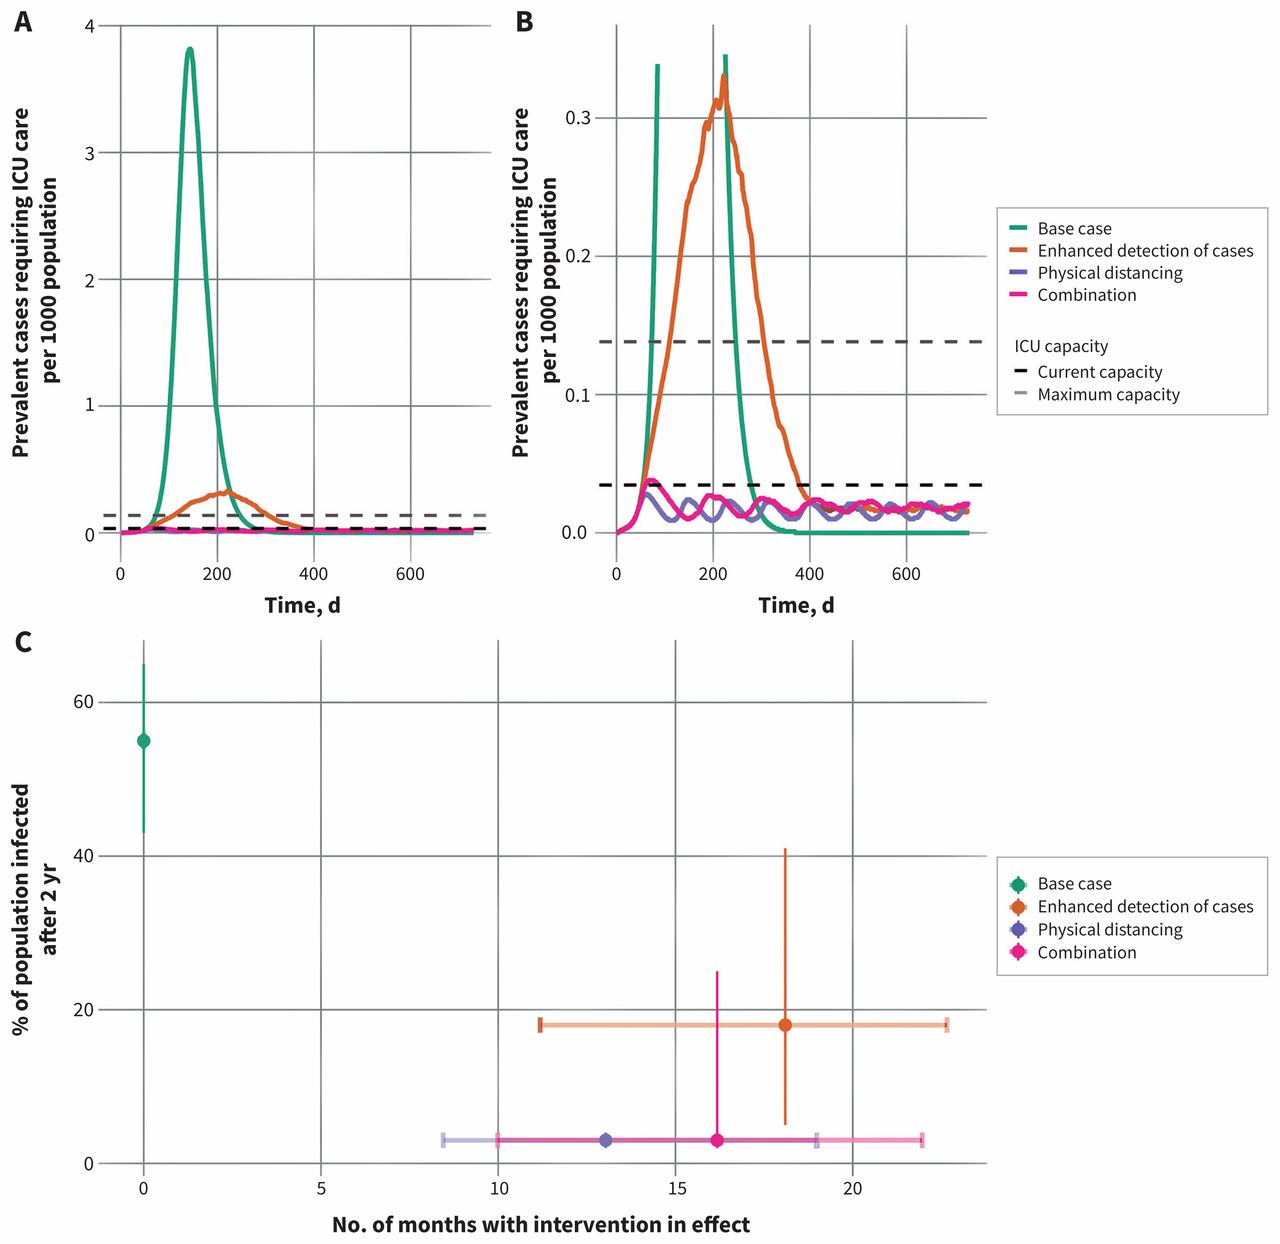
Projected intensive care unit (ICU) bed requirements and attack rates for dynamic interventions. (A) Prevalent cases requiring intensive care are shown for the base case and 3 intervention scenarios. Interventions are turned on and off (returning to base-case parameter values), depending on the number of COVID-19 cases in the ICU. Maximum and current ICU capacity in Ontario are indicated by the dashed horizontal lines. Median values are presented. (B) Zoomed view of prevalent ICU cases to show the dynamics for the enhanced physical-distancing and combination scenarios. (C) Model-projected estimates of percent of the population infected over the 2-year period. Attack rates include all incident infections, regardless of severity. The amount of time the dynamic interventions are in place is shown on the x-axis. Points indicate the median duration and lines the 95% credible intervals for each scenario.
Interpretation
COVID-19 poses an extraordinary challenge to societies. Whereas severe illness, particularly in older individuals, is frequent enough to overwhelm a society’s ICU capacity,27 mild unrecognized illness (particularly in younger individuals) contributes to spread,28 and outbreaks may be recognized only when superspreader events occur,25 often in settings like health care facilities.26 In contrast to severe acute respiratory syndrome (SARS),29 the high frequency of mild cases means that strategies that focus on case identification and isolation alone are likely to fail to prevent epidemic spread and overburdening of our health care system.26 As such, population-level interventions, with their attendant economic costs, have been used to prevent health systems from collapsing.30 Although events in China, Singapore, Hong Kong and elsewhere have shown that COVID-19 epidemics can be contained,30–33 the seeding of epidemics in countries around the globe, many with weak health systems,34 means that reintroduction of COVID-19 will continue to occur for some time. As successful containment efforts maintain a large number of susceptible individuals in populations, vulnerability to repeated epidemics is likely to persist until a COVID-19 vaccine is developed and manufactured at scale, or until large fractions of the population are infected and either die or develop immunity.35
Control strategies for COVID-19 thus need to balance competing risks: the risks of mortality and health system collapse, on the one hand, against economic risks and attendant hardships (and health consequences) on the other. In this work, we evaluated plausible strategies for attenuating the COVID-19 epidemic in Ontario, Canada. We focused on ICU resources for 2 reasons: first, because this component of most health systems represents a scarce resource prone to being saturated; and second, because such saturation results in abrupt surges in case-fatality, as individuals with acute respiratory distress syndrome will die quickly without the capacity for mechanical ventilation. In broad terms, we find that prolonged physical distancing is the preferred strategy for maintaining ICU resources, but an extreme fixed duration of physical distancing is required to prevent the epidemic from overwhelming ICU capacity. That said, physical distancing, even without reducing overall outbreak size, has the added benefit of delaying the epidemic peak, which gains time that can be used to build health system capacity and identify therapies and vaccines. However, societies remain vulnerable to resurgences as long as a critical fraction of the population remains susceptible to disease (that fraction can be approximated as 1/R0). Evaluating how that vulnerability changes over time will require seroepidemiologic studies, which have not yet been performed in Canada.
In contrast to fixed-duration physical distancing, we find that dynamic physical distancing, with interventions turned on and off as needed, based on ICU capacity crossing a given threshold, represents a more effective, and likely more palatable, control strategy. Physical distancing can be relaxed, but this inevitably results in resurgent disease in the population, requiring reinstatement. Nonetheless, dynamic physical distancing is projected to maintain ICU capacity, and dramatically reduces overall attack rates, while requiring less total physical distancing time than would be required by a fixed-duration strategy of comparable effectiveness. This may be counterintuitive; however, an important insight from our model is that dynamic interventions can be reactivated when resurgent outbreaks are still relatively small, leading to the high potency of such interventions.
Furthermore, dynamic physical distancing has the potential to allow populations, and the economy, to “come up for air” at intervals, which may make this strategy more sustainable. We also found that a combination approach, with less restrictive physical distancing along with enhanced testing, case isolation and quarantine, could have a similar effect in the dynamic scenario as more restrictive physical distancing alone. It is plausible that, as testing capacity increases, a combination approach that is less reliant on physical distancing will strike the right balance between disease control and societal disruption.36
Calibration to actual physical-distancing data is possible37 and is an area for future research. However, in broad terms, less restrictive physical-distancing regimes may be characterized by voluntariness and allowance of small gatherings, whereas more restrictive regimes include “lockdowns,” with individuals confined to home and facing legal sanction for emerging without legitimate reasons for doing so.38 Moving forward, any such disease-control regimes need to be coupled with improved surveillance systems, which permit needed adjustments in response to data.
Limitations
At the time of writing, well-documented limitations in testing capacity in Ontario,39 and a lack of information on ICU occupancy by COVID-19 patients, made it challenging to know where on the epidemic curve we currently find ourselves. The challenges in both scope of testing and pace of testing39 make case counts a poor metric of underlying disease activity. Acquisition of ICU occupancy data from the province has proved challenging, though needed metrics have recently become available from investigative reports.40 Importantly, we do not include within-hospital transmission cycles in this iteration of our model. Transmission in health care settings has the potential to quickly and dramatically reduce ICU capacity, by removing trained nurses, physicians and respiratory therapists from active duty, and by rapidly filling ICUs with new patients (health care workers, and patients admitted for other reasons with nosocomial COVID-19 infection).
Any model involves trade-offs between simplicity and realism, and in this work we have not attempted to model physical-distancing measures in a highly realistic way, but rather generically as reductions in contact frequency. Our understanding of the natural history of SARS-CoV-2 infection continues to evolve, and the precise role of presymptomatic and subclinical transmission is uncertain. Physical distancing becomes a more important control measure in the face of incomplete case ascertainment owing to asymptomatic or mildly symptomatic cases.
We do not offer precise policy prescriptions in terms of how the reductions associated with physical distancing that we model here are to be achieved, and we do not regard this model as a realistic recreation of current events in Ontario. As such our model is best interpreted qualitatively, rather than quantitatively.
The model does not include seasonality; it is possible that transmission will attenuate in the summer,41 resulting in a decline in cases that would be expected to resurge with the return of colder weather. Although our model’s several limitations are a source of uncertainty, nonetheless, the qualitative insights around the role of physical distancing, the relatively long intervention durations required to bend the epidemic curve, and the potential use of cyclic interventions can be used by policy-makers and decision-makers, along with emerging empirical evidence from other countries, to consider the best approaches for epidemic control over the coming months.
Lastly, we have not modelled the fact that abrupt surges in death resulting from full ICUs would result in lower demands for ICU beds. Our goal here is to inform policy so that such outcomes are avoided to the extent possible.
Conclusion
We have modelled plausible contours of the COVID-19 epidemic in Ontario, Canada, with a focus on maintenance of ICU resources. In the absence of substantial physical distancing or a combination of moderate physical distancing with enhanced case detection and isolation, we project that ICU resources would be quickly overwhelmed, a conclusion consistent with that in other modelling work,12 as well as current events in Italy and Spain. On a more positive note, we project that dynamic physical distancing, that reacts to changes in ICU occupancy, could maintain health system capacity and also allow periodic psychological and economic respite for populations.
Acknowledgements
The authors thank Gabrielle Brankston, Shannon French, Tanya Rossi and Matthew Van Camp from the Department of Population Medicine, University of Guelph for helping to compile data on population demographics and chronic conditions. The authors gratefully acknowledge assistance and input from Nelson Lee (University of Alberta), Allison McGeer (Mount Sinai Hospital), Janine McCready (Michael Garron Hospital, Toronto), Dick Zoutman (Scarborough Hospital Network), Jacqueline Willmore (Ottawa Public Health), Lydia Cheng (Peel Public Health), Monali Varia (Peel Public Health), Kristen Wheeler (Halton Public Health), Herveen Sachdeva (Toronto Public Health), Michael Finkelstein (Toronto Public Health), Monir Taha (Ottawa Public Health), Vera Etches (Ottawa Public Health), Isaac Bogoch (University Health Network), Chris Kandel (University Health Network and Michael Garron Hospital), Jeff Powis (Michael Garron Hospital) and Bart Harvey (Hamilton Public Health) in the formulation of plausible intervention scenarios tested in this analysis.
Footnotes
Competing interests: Amy Greer receives funding from the Natural Sciences and Engineering Research Council of Canada, the Canadian Institutes of Health Research (CIHR) and the Canada Research Chairs Program. No other competing interests were declared.
This article has been peer reviewed.
Contributors: All authors contributed to the conception and design of the work; acquisition, analysis and interpretation of data; drafting the work and revising it critically. All authors gave final approval to the version to be published and agreed to be held accountable for all aspects of the work.
Funding: The research was supported by a grant to David Fisman from CIHR (2019 COVID-19 rapid research funding OV4-170360).
Data sharing: All data used for parameterization of this model is in the public domain and can be accessed through references cited in the manuscript and technical appendix. Model code is not currently available, but will be made available in the coming weeks, when it is properly annotated and cleaned. In the interim, those interested in model code should contact David Fisman directly (david.fisman{at}utoronto.ca).
- Accepted April 2, 2020.
References
In this issue

Article tools


Jump to section
Related Articles
Cited By...
- Infection control strategies in essential industries: using COVID-19 in the food industry to model economic and public health trade-offs
- Predicting COVID-19 pandemic waves with biologically and behaviorally informed universal differential equations
- ADAPTIVE TIME LOCATION SAMPLING FOR COMPASS, A SARS-COV-2 PREVALENCE STUDY IN FIFTEEN DIVERSE COMMUNITIES IN THE UNITED STATES
- Developing forecasting capacity for public health emergency management in Africa using syndemics approach: lessons from the COVID-19 pandemic
- Multi-site disease analytics with applications to estimating COVID-19 undetected cases in Canada
- Mathematical modelling of COVID-19 with periodic transmission: The case of South Africa
- Impact of population mixing between vaccinated and unvaccinated subpopulations on infectious disease dynamics: implications for SARS-CoV-2 transmission
- Multi-faceted analysis of COVID-19 epidemic in the Republic of Korea considering Omicron variant: Mathematical modeling-based study
- Comprehensive compartmental model and calibration algorithm for the study of clinical implications of the population-level spread of COVID-19: a study protocol
- Impact of Population Mixing Between a Vaccinated Majority and Unvaccinated Minority on Disease Dynamics: Implications for SARS-CoV-2
- Estimating the effect of timetabling decisions on the spread of SARS-CoV-2 in medium-to-large engineering schools in Canada: an agent-based modelling study
- The basic reproduction number of COVID-19 across Africa
- Mathematical modeling of COVID-19 in British Columbia: an age-structured model with time-dependent contact rates
- COVID-19 Vaccination and Healthcare Demand
- How optimal allocation of limited testing capacity changes epidemic dynamics
- Assessing the impact of adherence to Non-pharmaceutical interventions and indirect transmission on the dynamics of COVID-19: a mathematical modelling study
- Effects of Various Policy Options on COVID-19 Cases in Nova Scotia including Vaccination Rollout Schedule: A Modelling Study
- Comparison of Pandemic Intervention Policies in Several Building Types Using Heterogeneous Population Model
- Are COVID-19 models blind to the social determinants of health? A systematic review protocol
- Estimating COVID-19 cases and deaths prevented by non-pharmaceutical interventions, and the impact of individual actions: a retrospective model-based analysis
- How can risk of COVID-19 transmission be minimised in domiciliary care for older people: development, parameterisation and initial results of a simple mathematical model
- Relative infectiousness of asymptomatic SARS-CoV-2 infected persons compared with symptomatic individuals: a rapid scoping review
- The interplay of policy, behavior, and socioeconomic conditions in early COVID-19 epidemiology in Georgia
- The multi-dimensional challenges of controlling SARS-CoV-2 transmission in indoor spaces: Insights from the linkage of a microscopic pedestrian simulation and virus transmission models
- The effect of population mobility restrictive measures on the incidence of SARS-CoV-2 infection in the early phase of the pandemic
- How the experience of medical assistance in dying changed during the COVID-19 pandemic in Canada: a qualitative study of providers
- Quantifying transmissibility of COVID-19 and impact of intervention within long-term health care facilities
- Transitioning to outpatient arthroplasty during COVID-19: time to pivot
- Prioritising COVID-19 vaccination in changing social and epidemiological landscapes
- SARS-CoV-2 Transmission in Alberta, British Columbia, and Ontario, Canada, January 1-July 6, 2020
- Parameter Estimation of COVID-19 Pandemic Model with Self Protection Behavior Changes
- Importation of SARS-CoV-2 following the "semaine de relache" and Quebecs COVID-19 burden - a mathematical modeling study
- The importance of saturating density dependence for predicting SARS-CoV-2 resurgence
- Age-structured SIR model and resource growth dynamics: A preliminary COVID-19 study
- Groundbreaking predictions about COVID-19 pandemic duration, number of infected and dead: A novel mathematical approach never used in epidemiology
- Decubitus ventral dans les cas dinsuffisance respiratoire hypoxemique lies a la COVID-19
- Social, economic, and environmental factors influencing the basic reproduction number of COVID-19 across countries
- Modelling interventions to control COVID-19 outbreaks in a refugee camp
- Bayesian Spatio-Temporal Modeling of COVID-19: Inequalities on Case-Fatality Risk
- COVID-19 transmission in the U.S. before vs. after relaxation of state social distancing measures
- Mathematical modelling of dynamics and containment of COVID-19 in Ukraine
- Cost and social distancing dynamics in a mathematical model of COVID-19 with application to Ontario, Canada
- Les bulles de travail : Comment les entreprises peuvent-elles rouvrir en reduisant le risque declosions de la COVID-19?
- Assessing required SARS-CoV-2 blanket testing rates for possible control of the outbreak in the epicentre Lusaka province of Zambia with consideration for asymptomatic individuals: a simple mathematical modelling study
- Integrated Vaccination and Non-Pharmaceutical Interventions based Strategies in Ontario, Canada, as a Case Study: a Mathematical Modeling Study
- Modelling COVID-19 using the Fundamentals of Fluid Dynamics
- A reductive analysis of a compartmental model for COVID-19: data assimilation and forecasting for the United Kingdom
- Assessing the burden of COVID-19 in Canada
- Vaccine Prioritisation Using Bluetooth Exposure Notification Apps
- Segmentation and shielding of the most vulnerable members of the population as elements of an exit strategy from COVID-19 lockdown
- Modelling interventions to control COVID-19 outbreaks in a refugee camp
- Estimating the impact of COVID-19 control measures using a Bayesian model of physical distancing
- Difficultes associees a levaluation des vaccins contre le SRAS-CoV-2 pendant la pandemie de COVID-19
- Effets projetes des mesures de sante publique non pharmacologiques visant a prevenir la recrudescence de la transmission du SRAS-CoV-2 au Canada
- Prone positioning for patients with hypoxic respiratory failure related to COVID-19
- The potential impact of School Closure Relative to Community-based Non-pharmaceutical Interventions on COVID-19 Cases in Ontario, Canada
- Estimation de lepuisement des ressources hospitalieres attribuable a la COVID-19 en Ontario, au Canada
- Comprendre lheterogeneite pour guider la reponse de la sante publique a la COVID-19 au Canada
- The signature features of COVID-19 pandemic in a hybrid mathematical model - implications for optimal work-school lockdown policy
- Working in a bubble: How can businesses reopen while limiting the risk of COVID-19 outbreaks?
- Local lockdowns outperform global lockdown on the far side of the COVID-19 epidemic curve
- Projected effects of nonpharmaceutical public health interventions to prevent resurgence of SARS-CoV-2 transmission in Canada
- Challenges in evaluating SARS-CoV-2 vaccines during the COVID-19 pandemic
- Incubation period of COVID-19: a rapid systematic review and meta-analysis of observational research
- Inferred duration of infectious period of SARS-CoV-2: rapid scoping review and analysis of available evidence for asymptomatic and symptomatic COVID-19 cases
- Understanding heterogeneity to inform the public health response to COVID-19 in Canada
- Estimation of COVID-19-induced depletion of hospital resources in Ontario, Canada
More in this TOC Section
Similar Articles
Collections

