


Abstract
Background Readmissions to hospital are increasingly being used as an indicator of quality of care. However, this approach is valid only when we know what proportion of readmissions are avoidable. We conducted a systematic review of studies that measured the proportion of readmissions deemed avoidable. We examined how such readmissions were measured and estimated their prevalence.
Methods We searched the MEDLINE and EMBASE databases to identify all studies published from 1966 to July 2010 that reviewed hospital readmissions and that specified how many were classified as avoidable.
Results Our search strategy identified 34 studies. Three of the studies used combinations of administrative diagnostic codes to determine whether readmissions were avoidable. Criteria used in the remaining studies were subjective. Most of the studies were conducted at single teaching hospitals, did not consider information from the community or treating physicians, and used only one reviewer to decide whether readmissions were avoidable. The median proportion of readmissions deemed avoidable was 27.1% but varied from 5% to 79%. Three study-level factors (teaching status of hospital, whether all diagnoses or only some were considered, and length of follow-up) were significantly associated with the proportion of admissions deemed to be avoidable and explained some, but not all, of the heterogeneity between the studies.
Interpretation All but three of the studies used subjective criteria to determine whether readmissions were avoidable. Study methods had notable deficits and varied extensively, as did the proportion of readmissions deemed avoidable. The true proportion of hospital readmissions that are potentially avoidable remains unclear.
See related commentary by Goldfield at www.cmaj.ca/cgi/doi/10.1503/cmaj.110448
In most instances, unplanned readmissions to hospital indicate bad health outcomes for patients. Sometimes they are due to a medical error or the provision of suboptimal patient care. Other times, they are unavoidable because they are due to the development of new conditions or the deterioration of refractory, severe chronic conditions.
Hospital readmissions are frequently used to gauge patient care. Many organizations use them as a metric for institutional or regional quality of care.1 The widespread public reporting of hospital readmissions and their use in considerations for funding implicitly suggest a belief that readmissions indicate the quality of care provided by particular physicians and institutions.
The validity of hospital readmissions as an indicator of quality of care depends on the extent that readmissions are avoidable. As the proportion of readmissions deemed to be avoidable decreases, the effort and expense required to avoid one readmission will increase. This decrease in avoidable admissions will also dilute the relation between the overall readmission rate and quality of care. Therefore, it is important to know the proportion of hospital readmissions that are avoidable.
We conducted a systematic review of studies that measured the proportion of readmissions that were avoidable. We examined how such readmissions were measured and estimated their prevalence.
Methods
Literature search
We consulted a local information scientist to develop a search strategy to identify studies that measured the proportion of readmissions deemed avoidable (Appendix 1, available at www.cmaj.ca/cgi/content/full/cmaj.101860/DC1). We applied this strategy to search the MEDLINE and EMBASE databases for English-language papers published from 1966 to July 2010. Full-text versions of citations were retrieved for complete review if they specified that hospital readmissions were counted; and the title or abstract used any term(s) indicating that readmissions were classified as avoidable (or “preventable,” “needless” or “unnecessary”) or not.
We included studies if they included a population of hospital readmissions and if they counted the number of readmissions that they classified as avoidable. The references of all included studies were reviewed to identify other eligible analyses. In addition, we reviewed the links of all PubMed “related articles” of each included study.
Data abstraction
Data abstracted from each study included basic study information (publication year, journal); inclusion criteria for, and numbers of, index admissions and readmissions; follow-up period after index admission within which readmissions were considered; whether or not information from potential sources (e.g., index admission, clinic visits between index and readmission, readmission, interviews with treating physicians or nurses, interviews with patients or families) were used when determining avoidability of readmissions; and the criteria required for readmissions to be classified as avoidable.
We abstracted the number of reviewers used (per readmission) and whether or not readmissions attributable to specific groups or factors were considered avoidable. We searched for these groups or factors in the methods section and in descriptions of avoidable readmissions in each study and classified them as treating physician (e.g., medical errors, omissions of care); nurse (e.g., inadequate dressings); patient (e.g., noncompliance with therapy); social (e.g., inability of family to care for patient in community); and system (e.g., home care unavailable).
Two of us (C.B. and A.J.) independently abstracted data from a random sample of 10 studies to compare agreement and implement abstraction criteria to harmonize abstraction. Subsequently, a single reviewer (C.B. or A.J.) abstracted data from all of the remaining studies. All abstractions were reviewed and confirmed by the lead author (C.v.W.).
Statistical analysis
Basic descriptive statistics for each study were calculated. To explore study heterogeneity, we created a meta-regression model that measured the association of study factors with the proportion of readmissions deemed avoidable. The three studies that used administrative data to identify avoidable readmissions were methodologically distinct from the others and did not define many of the variables required for the meta-regression. We therefore grouped these three studies together and included the remaining studies in the the meta-regression model. Study factors that were not defined were defaulted to null for our model.
Model building used 13 candidate binary variables (e.g., year study was published; use of administrative databases; number of reviewers involved; length of follow-up period; factors included, and sources of information used, in determining avoidability of readmissions; location and type of hospital; type of hospital service to which patients were admitted; and whether or not limited number of diagnoses included). In the models, studies were weighted by the inverse of the variance for the proportion of readmissions deemed avoidable. Ordinal and continuous variables were transformed into binary variables by their median values. This created a model that allowed us to group studies based on values of each independently significant covariate. We used forward selection methods to identify the study factors that had the strongest independent association with the proportion of readmissions deemed avoidable. We limited the regression model to three covariates (about 10 observations per covariate) to avoid overfitting.2 To determine goodness of fit, we calculated the Akaike information criterion value for all possible three-variable models.
Studies were grouped based on their values of the binary covariates included in the final meta-regression model. To calculate the overall proportion of readmissions deemed avoidable for studies in each group, we weighted studies by the inverse of their variance.3 Heterogeneity of results within each group was measured using the Cochran Q and the I2 statistics.3,4
Results
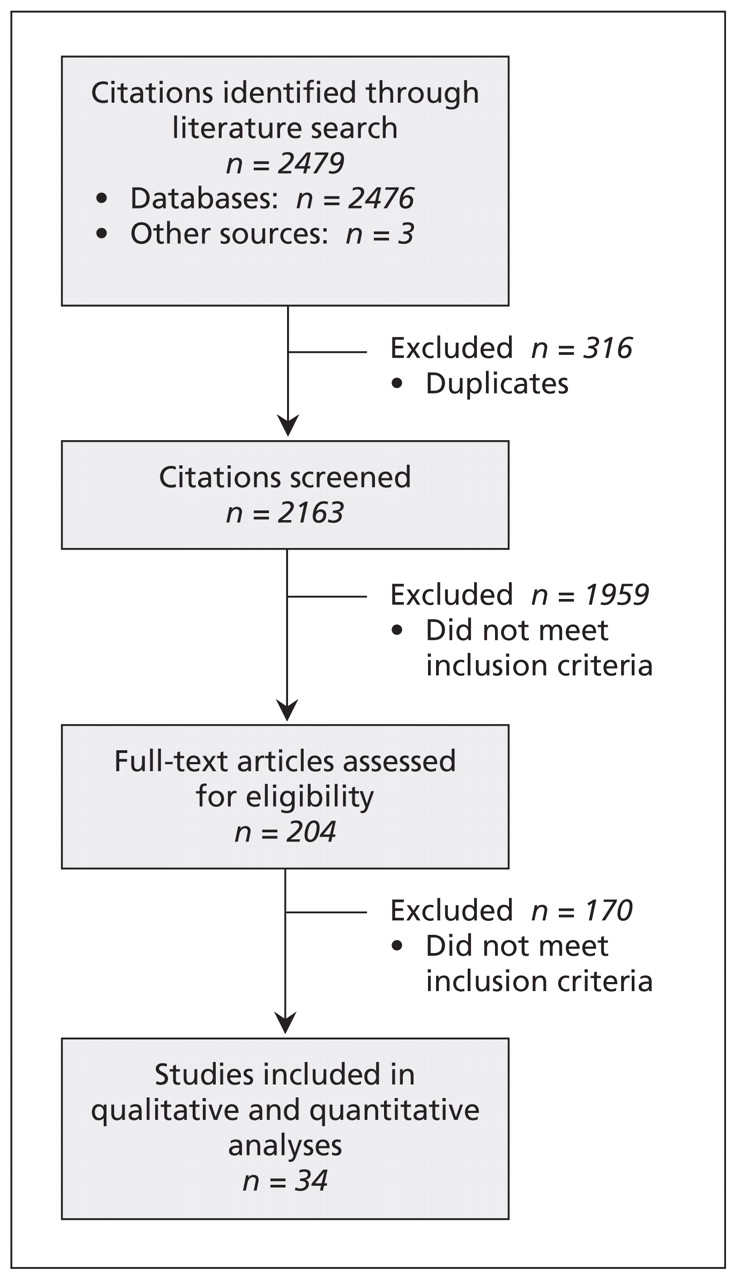
Figure 1 presents the results of our search strategy. After screening 2163 citations, we reviewed the full-text articles of 204 studies. Thirty-four of the studies measured the proportion of hospital readmissions deemed avoidable.5–38

Selection of studies that measured the proportion of hospital readmissions deemed avoidable.
A summary of the studies’ characteristics appears in Table 1. The included studies were published between 1983 and 2009 (median year 2000). Most of the studies were conducted at single centres; almost two-thirds were conducted primarily in teaching hospitals. Patients were most commonly admitted to medical, surgical and geriatric services. Most of the studies included all readmissions regardless of the diagnosis; four (12.5%) restricted readmissions to particular diagnoses, including congestive heart failure,16,38 diabetes,16 obstructive lung disease16 and adverse drug reactions.34 Half of the studies limited readmissions to those that occurred within three months after discharge. Most of the studies were moderately sized, with a median of 151 readmissions (interquartile range [IQR] 75–313). Studies originated primarily from the United Kingdom5,8–10,13–15,21,24–26,31,36–38 and the United States.7,11,12,16–18,22,27,33
Summary of characteristics of 34 studies that measured the proportion of hospital readmissions deemed avoidable
Criteria used to identify avoidable readmissions
Criteria used to identify avoidable readmissions varied extensively between the studies (see Table 2, at the end of the article). Three studies18,27,33 used only administrative data in their analyses and classified readmissions based on combinations of diagnostic codes between the index admission and the readmission. For example, in the study by Goldfield and colleagues, all readmissions with a diagnostic code of diabetes for which the index admission had a diagnostic code of myocardial infarction were classified as avoidable.33
Characteristics of studies included in the meta-analysis (part 1 of 4)
Criteria used in the rest of the studies fell into one of four general groups. Four studies did not specify the criteria used to classify readmissions, stating that reviewers judged which readmissions were avoidable.12,17,25,26 Eleven studies described criteria that were subjective, citing few or no qualifiers or guides for reviewers.6,13,14,16,21,22,24,31,35,37,38 Three studies used criteria that focused exclusively on adverse drug reactions.20,34,36 Miles and Lowe used methods similar to those in studies of adverse events, with a defined six-point scale to determine whether readmissions were avoidable.20
In the fourth group, 13 studies used criteria with several qualifiers provided to define “avoidable,” often providing categories for avoidable readmissions.5,7–11,15,19,23,28–30,32 Several studies within this category were notable: Graham and Livesley classified readmissions into one of five groups,5 and their methods were the most commonly replicated in other studies; MacDowell and colleagues used an algorithmic method to identify avoidable readmissions;7 and Halfon and coauthors provided detailed and specific criteria to determine avoidability stratified by phases of patient care.23
Perhaps with the exception of criteria dealing exclusively with adverse drug events, criteria used to identify avoidable readmissions were subjective and left reviewers much room to make decisions regarding whether or not readmissions were avoidable.
We noted large variations between studies in the application of criteria (Table 1). Of the 31 studies that indicated the number of reviewers involved in determining the avoidability of each readmission, most (17, 54.8%) used only one reviewer; the maximum number was three reviewers per readmission (7 studies, 22.6%). Studies varied in the sources of information used to determine avoidability. Most included information abstracted from the medical record of the index admission (25 studies, 80.6%) or the readmission (27 studies, 87.1%). Information from clinic notes between the index admission and readmission were used in about one-third of the studies. Information from interviews with treating physicians and patients was used in less than one-third of the studies. Finally, studies varied on whether or not readmissions attributable to specific groups or factors were considered avoidable. The most common factors included actions or omissions on the part of treating physicians or hospitals (28 studies, 90.3%). All of the other factors, including those attributable to the patient (7 studies, 22.6%) and social issues (16 studies, 51.6%), were much less commonly considered when determining the avoidability of readmissions.
Proportion of readmissions deemed avoidable
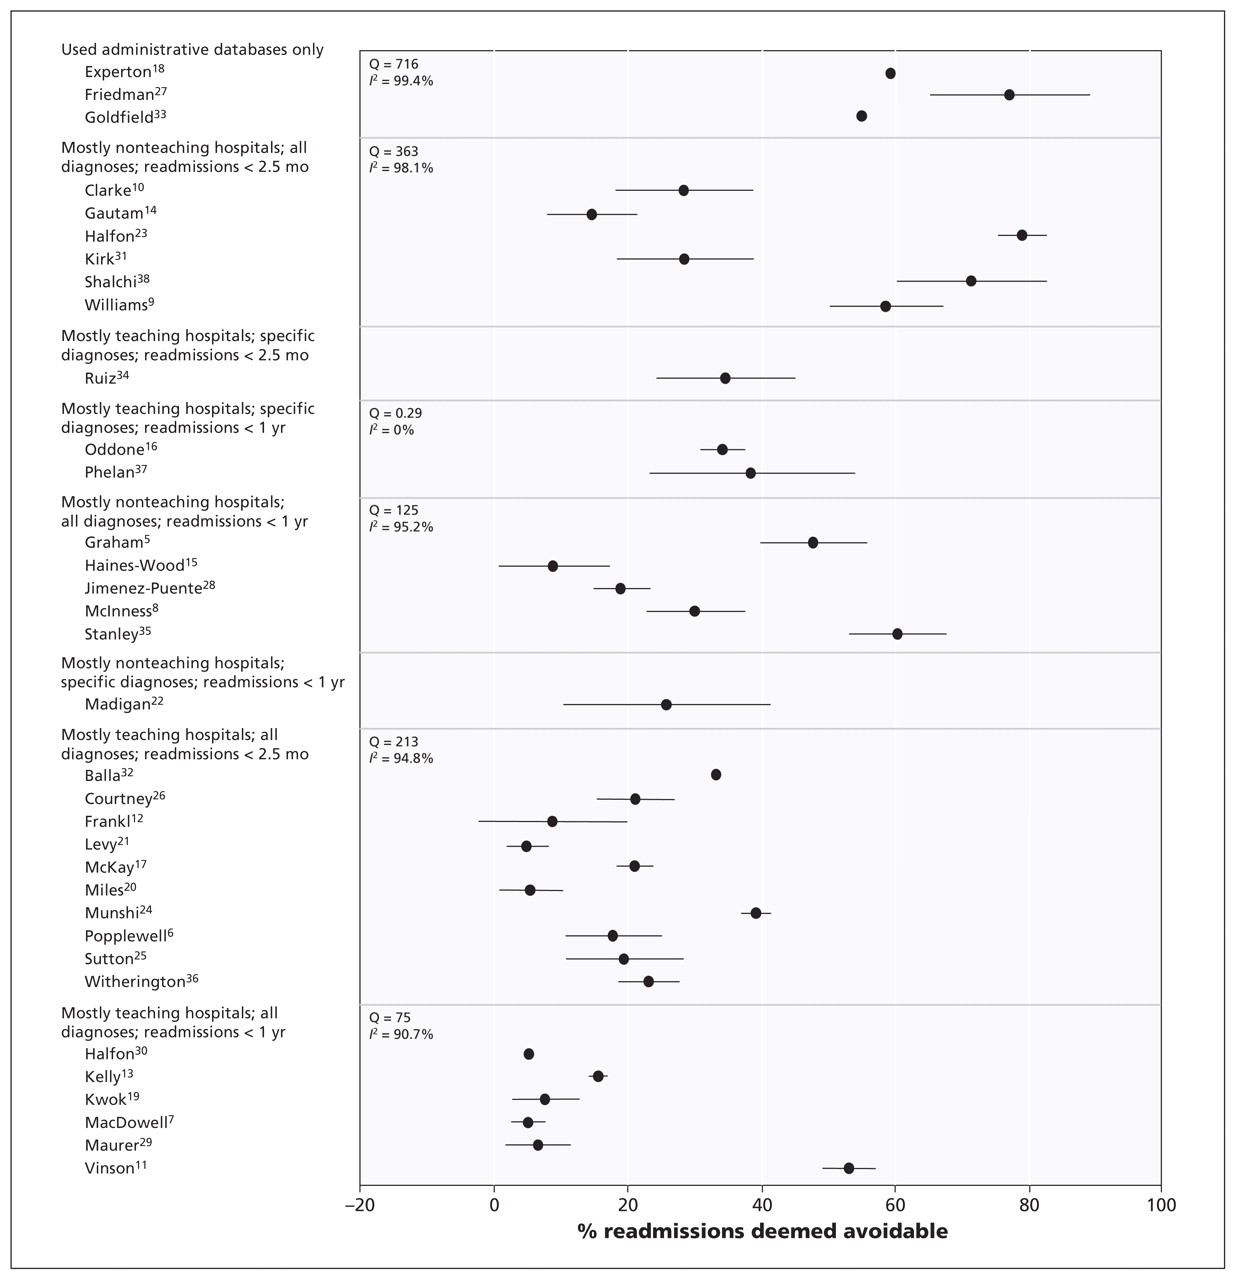
The proportion of readmissions deemed avoidable varied extensively between the studies (Tables 1 and 3). The median unweighted proportion was 27.1%, although the range was 5.0%–78.9% (Figure 2, Table 3). In the 19 studies that used the index admission as the unit of analysis, avoidable readmissions were noted in a median of 2.2% of discharges (IQR 1.5%–7.0%).

Proportion of hospital readmissions deemed avoidable. Studies are grouped based on the value of study factors with the strongest association with this outcome (Table 4). Error bars = 95% confidence intervals.
Results of studies included in the meta-analysis
Many study-level factors were reported to be associated with the proportion of readmissions deemed avoidable (Table 4). In the univariable analysis, studies that used administrative data had notably higher proportions of avoidable readmissions than studies that used other criteria. Proportions of readmissions deemed avoidable were significantly higher in studies in which patients were from medical services than in studies without such patients or in which patient type was not specified. Studies reporting the lowest proportions of avoidable readmissions included those conducted primarily in teaching hospitals and those that only included avoidable readmissions due to physician factors. Surprisingly, studies that involved more than one reviewer per case had higher proportions of avoidable readmissions than those involving one reviewer.
Association between study-level factors and proportion of readmissions deemed avoidable in binomial regression models*
In the multivariable analysis, the three study-level factors associated with significantly high proportions of avoidable readmissions (and therefore retained in the model) were limiting of readmissions to those with specific diagnoses, a follow-up period of up to one year after the index admission and having teaching hospitals make up the majority of hospitals in the study (Table 4). This model had the lowest Akaike Information Criterion goodness-of-fit value (658) of all possible three-variable models in our study.
The three factors in our multivariable model explained some of the heterogeneity in the study results. In Figure 2, we grouped studies based on their values for the three binary covariates that made it into the final model (Table 4). Within each group, we calculated the weighted proportion of avoidable readmissions for the group, the Cochran Q value and the I2 value. In three combinations of study-level factors, heterogeneity was resolved (Figure 2), but only one of these groups (with the three factors of mostly teaching hospitals, specific diagnoses and readmissions within one year after discharge) contained more than one study. That significant heterogeneity persists after clustering studies based on the most important study-level factors indicates the extensive amount of heterogeneity in these studies.
Interpretation
Readmissions to hospital are increasingly being used as a quality-of-care measure. They can indicate quality of care, however, only if an important proportion of them are deemed avoidable. In our systematic review, we identified 34 studies that measured the proportion of readmissions deemed avoidable. Subjective criteria and variable methods were used in every study. The proportions of readmissions deemed avoidable varied widely between the studies. This variability makes it difficult to state with any certainty how often readmissions are preventable. Nevertheless, the median proportion of readmissions deemed avoidable (27.1%) is certainly lower than the 76% reported in 2007 by the Medicare Payment Advisory Commission to the US Congress.39 Although the variation seen in these studies could reflect true differences in quality of patient care, it also reflects the subjectivity of the outcome itself as well as differences in study characteristics, including patient and hospital types included; factors considered in determining avoidability of readmissions; sources of information used to judge avoidable status; and the minimum number of reviewers per case.
Although subjectivity will always exist when determining whether readmissions are avoidable, steps can be taken to minimize resulting error. First, parameters required for reviewing readmissions — such as which factors responsible for a readmission (e.g., physician, nurse, patient) are classified as avoidable — need to be clarified. Second, the use of multiple reviewers is essential when dealing with subjective outcomes such as avoidable readmissions. Because the accuracy of reviews is never perfect, the use of multiple reviewers helps ensure that patient classifications are as accurate as possible. Finally, latent class models can be used to analyze multiple reviews and generate the probability that each patient truly had an avoidable readmission.40–42 We believe that such models may be useful to classify avoidable readmissions more reliably.
Limitations
Our study has limitations. First, although we used a clear and sensible search strategy that identified a large number of studies, we may have missed relevant publications. In addition, we limited studies to those published in English. However, given the large number of studies included in our review, it is unlikely that our overall conclusions would change meaningfully if any missed studies were included.
Second, we used transparent meta-regression modelling to identify the most important sources of heterogeneity between studies. Although we limited this model to three covariates to avoid overfitting of the model, significant heterogeneity remained. This finding is not unexpected given the extensive amount of heterogeneity between the studies (Figure 2). In addition, the model’s outcome (proportion of readmissions deemed avoidable) will have notable error in it because of the subjectivity involved in the classification of readmissions as avoidable or not. This error will not be captured by the study-level factors in our regression model.
Third, we combined studies from different health care systems. Although some factors contributing to the proportion of avoidable readmissions are likely universal (e.g., incorrect diagnosis), other factors influencing readmission rates that are unique to particular health care systems (e.g., health insurance coverage) will not be captured in our model.
Finally, we were unable to summarize disease-specific proportions of avoidable readmissions, because they were rarely reported in studies that included a broad assortment of diseases. Future studies would need to address this issue to identify possible diseases that could be targeted for interventions to decrease the risk of avoidable readmissions.
Conclusion
Our study showed that the proportion of hospital readmissions deemed avoidable has yet to be reliably determined. Furthermore, we found a lack of consensus regarding the methods necessary to judge whether readmissions are avoidable. Given the large variation in the proportion of avoidable readmissions between studies using primary data, “avoidability” cannot accurately be inferred based on diagnostic codes for the index admission and the readmission. Instead, it needs to be determined through a peer-review process in which readmissions are classified as avoidable or not based on expert opinion.
Criteria used in future studies need to focus on determining whether the readmission was preceded by an adverse event (i.e., a bad medical outcome due to medical care rather than the natural history of disease or bad luck); whether the adverse event could have been prevented; and whether the readmission would have occurred even without the adverse event or whether other factors were involved. In addition, future studies need to include a large number of readmissions in a broad spectrum of patients from multiple teaching and community hospitals; multiple sources of patient information between index admission and readmission on which decisions regarding avoidabililty are based; an explicit statement about which groups or factors contributing to readmissions are considered avoidable; at least three reviewers per readmission to judge avoidability; and the use of structural modelling methods such as the latent class model to measure the probability that patients truly had an avoidable readmission based on the judgments of reviewers.
Footnotes
-
Competing interests: None declared.
-
This article has been peer reviewed.
-
Contributors: All of the authors made substantial contributions to the conception and design of the study and the acquisition, analysis and interpretation of the data. Carl van Walraven, Peter Austin and Alan Forster drafted the article; all of the authors revised the manuscript critically for important intellectual content and approved the final version submitted for publication. Carl van Walraven had full access to all of the data in the study; he takes responsibility for the integrity of the data and the accuracy of the data analysis.
-
Funding: This study was supported by the Department of Medicine, University of Ottawa, Ottawa, Ont.
References
In this issue

Article tools


Jump to section
Related Articles
Cited By...
- Prediction of Unplanned Hospital Readmission using Clinical and Longitudinal Wearable Sensor Features
- Novel machine learning model for predicting multiple unplanned hospitalisations
- Perceived discharge quality and associations with hospital readmissions and emergency department use: a prospective cohort study
- Identification of factors associated with high-cost use of inpatient care in chronic kidney disease: a registry study
- Strategies to Reduce Rehospitalization in Patients with CKD and Kidney Failure
- Development of a risk prediction model of potentially avoidable readmission for patients hospitalised with community-acquired pneumonia: study protocol and population
- Study of potentially preventable hospitalisations (PPH) for chronic conditions: what proportion are preventable and what factors are associated with preventable PPH?
- Can we predict early 7-day readmissions using a standard 30-day hospital readmission risk prediction model?
- SAFety, Effectiveness of care and Resource use among Australian Hospitals (SAFER Hospitals): a protocol for a population-wide cohort study of outcomes of hospital care
- Improving transitions from acute care to home among complex older adults using the LACE Index and care coordination
- Bedscales: A non-contact adherence-independent multi-person sensor for longitudinal physiologic monitoring in the home bed
- Stroke readmissions: Playing defense?
- Predicting risk of unplanned hospital readmission in survivors of critical illness: a population-level cohort study
- Patient experiences using a novel tool to improve care transitions in patients with heart failure: a qualitative analysis
- Reducing readmission rates through a discharge follow-up service
- Timely Outpatient Follow-up Is Associated with Fewer Hospital Readmissions among Patients with Behavioral Health Conditions
- What is the impact on the readmission ratio of taking into account readmissions to other hospitals? A cross-sectional study
- Analysis and Prediction of Unplanned Intensive Care Unit Readmission using Recurrent Neural Networks with Long Short-Term Memory
- Patient vs provider perspectives of 30-day hospital readmissions
- Unplanned early hospital readmission among critical care survivors: a mixed methods study of patients and carers
- Partners at Care Transitions: exploring healthcare professionals perspectives of excellence at care transitions for older people
- ModelHeart: a resident-led implementation of metrics to reduce 30-day heart failure readmissions
- Thirty-day hospital readmission and emergency department visits after vascular surgery: a Canadian prospective cohort study
- Protocol for a mixed methods study of hospital readmissions: sensemaking in Veterans Health Administration healthcare system in the USA
- Effectiveness of a financial incentive to physicians for timely follow-up after hospital discharge: a population-based time series analysis
- Simplification of the HOSPITAL score for predicting 30-day readmissions
- A local quality initiative to improve follow-up times for patients with heart failure
- Team-based versus traditional primary care models and short-term outcomes after hospital discharge
- Visit Entropy Associated with Hospital Readmission Rates
- Association of 30-Day Readmission Metric for Heart Failure Under the Hospital Readmissions Reduction Program With Quality of Care and Outcomes
- No Exit: Identifying Avoidable Terminal Oncology Intensive Care Unit Hospitalizations
- Do Acute Myocardial Infarction and Heart Failure Readmissions Flagged as Potentially Preventable by the 3M Potentially Preventable Readmissions Software Have More Process-of-Care Problems?
- Worlds Apart: The Hype and Reality of Big Data to Improve Health Care
- Influence of Sacubitril/Valsartan (LCZ696) on 30-Day Readmission After Heart Failure Hospitalization
- Person-centred pharmaceutical care reduces emergency readmissions
- National characteristics and predictors of neurologic 30-day readmissions
- ReCAP: Insights Into the Potential Preventability of Oncology Readmissions
- Preoperative prediction of potentially preventable morbidity after fast-track hip and knee arthroplasty: a detailed descriptive cohort study
- Do pneumonia readmissions flagged as potentially preventable by the 3M PPR software have more process of care problems? A cross-sectional observational study
- Association of Rehabilitation Intensity for Stroke and Risk of Hospital Readmission
- Identifying preventable readmissions: an achievable goal or waiting for Godot?
- Diagnosing Potentially Preventable Hospitalisations (DaPPHne): protocol for a mixed-methods data-linkage study
- Physician experience and outcomes among patients admitted to general internal medicine teaching wards
- Association between frailty and 30-day outcomes after discharge from hospital
- Facility-Level Variation in Hospitalization, Mortality, and Costs in the 30 Days After Percutaneous Coronary Intervention: Insights on Short-Term Healthcare Value From the Veterans Affairs Clinical Assessment, Reporting, and Tracking System (VA CART) Program
- Hospital Readmissions Reduction Program
- Classifying emergency 30-day readmissions in England using routine hospital data 2004-2010: what is the scope for reduction?
- Pneumonia Readmissions: Risk Factors and Implications
- Effect of a national primary care pay for performance scheme on emergency hospital admissions for ambulatory care sensitive conditions: controlled longitudinal study
- Characterizing Types of Readmission After Acute Coronary Syndrome Hospitalization: Implications for Quality Reporting
- Transitional Care Interventions Prevent Hospital Readmissions For Adults With Chronic Illnesses
- Safely and effectively reducing inpatient length of stay: a controlled study of the General Internal Medicine Care Transformation Initiative
- Site of hospital readmission and mortality: a population-based retrospective cohort study
- Identification of Potentially Avoidable Hospitalizations in Patients With GI Cancer
- Do Cardiology Quality Measures Actually Improve Patient Outcomes?
- Home care: more than just a visiting nurse
- Defining quality outcomes for complex-care patients transitioning across the continuum using a structured panel process
- Decreasing readmissions: it can be done but one size does not fit all
- Preventable Readmissions Within 30 Days of Ischemic Stroke Among Medicare Beneficiaries
- Strategies for Reducing Potentially Avoidable Hospitalizations for Ambulatory Care-Sensitive Conditions
- Limits Of Readmission Rates In Measuring Hospital Quality Suggest The Need For Added Metrics
- Home-care nurses' perceptions of unmet information needs and communication difficulties of older patients in the immediate post-hospital discharge period
- Transitional interventions to reduce early psychiatric readmissions in adults: systematic review
- Patient-Identified Factors Related to Heart Failure Readmissions
- Development of a predictive model to identify inpatients at risk of re-admission within 30 days of discharge (PARR-30)
- There Must Be a Better Way: Piloting Alternate Routes Around Heart Failure Hospitalizations
- Causes and patterns of readmissions in patients with common comorbidities: retrospective cohort study
- Improving patient outcomes with better care transitions: The role for home health
- Changes in Heart Failure Outcomes After a Province-Wide Change in Health Service Provision A Natural Experiment in Alberta, Canada
- Trends and predictors of rehospitalisation following an acute coronary syndrome: report from the Australian and New Zealand population of the Global Registry of Acute Coronary Events (GRACE)
- Contemporary Evidence About Hospital Strategies for Reducing 30-Day Readmissions: A National Study
- Rehospitalization for Heart Failure: Predict or Prevent?
- The Three-Phase Terrain of Heart Failure Readmissions
- Not All Readmissions Are Created Equal
- How important is it to identify avoidable hospital readmissions with certainty?
More in this TOC Section
Similar Articles
Collections

