


Abstract
Background: Uptake of virtual care increased substantially during the first year of the COVID-19 pandemic. The aim of this study was to evaluate whether a shift from in-person to virtual visits by primary care physicians was associated with increased use of emergency departments among their enrolled patients.
Methods: We conducted an observational study of monthly virtual visits and emergency department visits from Apr. 1, 2020, to Mar. 31, 2021, using administrative data from Ontario, Canada. We used multivariable regression analysis to estimate the association between the proportion of a physician’s visits that were delivered virtually and the number of emergency department visits among their enrolled patients.
Results: The proportion of virtual visits was higher among female, younger and urban physicians, and the number of emergency department visits was lower among patients of female and urban physicians. In an unadjusted analysis, a 1% increase in a physician’s proportion of virtual visits was found to be associated with 11.0 (95% confidence interval [CI] 10.1–11.8) fewer emergency department visits per 1000 rostered patients. After controlling for covariates, we observed no statistically significant change in emergency department visits per 1% increase in the proportion of virtual visits (0.2, 95% CI −0.5 to 0.9).
Interpretation: We did not find evidence that patients substituted emergency department visits in the context of decreased availability of in-person care with their family physician during the first year of the COVID-19 pandemic. Future research should focus on the long-term impact of virtual care on access and quality of patient care.
Access and continuity are important health system characteristics for the prevention and management of chronic diseases and treatment of nonurgent acute concerns.1,2 Virtual care has the potential to improve both of these characteristics. It has also been associated with improved therapeutic effects, efficiency gains, patient satisfaction and compliance.3 Despite these potential benefits, virtual care was not widely adopted in Canada before the COVID-19 pandemic. In 2018, only 4% of family physicians in Canada were offering video visits.4 Some prepandemic studies found reduced quality and inconsistent results regarding patient experiences with virtual care, even with improved access.3,5 The pandemic pushed health care systems to rapidly implement virtual primary care; physicians in Canada were directed to restrict in-office visits and provide care virtually whenever possible.6 One Ontario-based study found a 5600% increase in virtual visits early in the pandemic, while in-office visits decreased by 79%, compared with the same period in 2019.7 Several Canadian studies also reported that emergency department visits declined during the first wave of the pandemic, possibly owing to avoidance of in-person urgent care from fear of contracting SARS-CoV-2.8–10
In later stages of the pandemic, questions arose about the quality of virtual care and the broader system effects of reduced access to in-person care, such as patients substituting emergency department visits when in-person care options were unavailable.11–13 The impact of virtual care on emergency department use has been studied elsewhere, but we are not aware of published studies in the context of the COVID-19 pandemic in Ontario. Six studies found that virtual care had no impact on use of emergency departments, as described in a review article, but 1 study reported that nurse consultations via telephone were associated with increased emergency department visits.14 Observational studies found no association between virtual care and subsequent or reduced emergency department use.15,16 Several studies found that patients self-reported that they would use the emergency department 4%–12% of the time if no virtual care options were available.15,17,18
We aimed to evaluate whether a shift from in-person to virtual visits by primary care physicians in patient enrolment practices was associated with increased use of emergency departments among their enrolled patients during the first year of the COVID-19 pandemic.
Methods
Study design and setting
In this observational study of family physicians in patient enrolment practices in Ontario, Canada, we used physician-level administrative data on aggregated monthly emergency department visits for enrolled patients and proportion of virtual visits from Apr. 1, 2020, to Mar. 31, 2021. All physicians were enrolled in either an enhanced fee-for-service model in a family health group or a blended capitation model in a family health organization during the study period.
Family physicians in Ontario may choose from a variety of payment models funded by the single payer, the Ontario Health Insurance Plan. Currently, family health groups and family health organizations are the 2 most common models in Ontario, together accounting for more than half of all primary care physicians. One study found that patients enrolled with physicians in family health groups had higher levels of morbidity and comorbidity, and lower mean emergency department visits, compared with those in family health organizations.19 Emergency department services are fully paid by the Ontario Health Insurance Plan and, thus, patients have no financial disincentive to seek non-urgent emergency department care. We included only physicians practising in family health group and family health organization models because formal patient enrolment made it possible to calculate physician roster sizes and to link patients to physicians during the study period. We excluded physicians with missing roster data and those who switched payment models during the study period.
Data sources
We obtained data on physicians’ virtual visits and patient emergency department visits from claims data, which included fee-for-service and shadow billings (i.e., claims records in non-fee-for-service models, including emergency department alternative funding arrangements, incentivized by billings premiums). We acquired patient enrolment data from the Client Agency Enrolment Program database. We obtained physician characteristics from the Corporate Provider Database, and data on patient complexity from the Canadian Institute for Health information’s Population Grouping Methodology.20,21
Variables
The key outcome variable was the number of emergency department visits per rostered patient, identified from billing codes in the claims data (Appendix 1, available at www.cmaj.ca/lookup/doi/10.1503/cmaj.212051/tab-related-content), matched with physician’s patient enrolment data. We then divided the number of emergency department visits for all patients of each physician by their roster size.
The key exposure variable was the proportion of the physician’s total visits that were virtual visits, calculated by dividing the number of virtual visits by total (in-person and virtual) visits for assessments and consultations (Appendix 1). We identified virtual visits during the COVID-19 period from billing codes as either video visits on the Ontario Telemedicine Network, or by new billing codes for telephone or video visits that were introduced in response to the pandemic, effective Mar. 14, 2020.22
Covariates included the physician’s payment model; total visits per rostered patient; the physician’s average patient complexity, measured by 2018 resource intensity weights (in quintiles); regionality, defined by Ontario’s 49 census divisions from Statistics Canada;23 rurality, defined by Rurality Index of Ontario scores and categorized into urban (score 0), semiurban (score 1–39) and rural (score ≥ 40); average patient age; proportion of male patients in a physician’s practice; and prepandemic emergency department visits per rostered patient (2019 fiscal year).
Statistical analysis
We determined monthly trends in emergency department visits and the proportion of virtual visits, and average values of key variables by select physician characteristics. We performed statistical tests to measure differences in average value. We compared the number of emergency department visits in the claims data with the number of triaged visits in data from the National Ambulatory Care Reporting System for the same time period to ensure data completeness.
We used general estimating equations regression analysis to estimate the association between a physician’s proportion of virtual visits and emergency department visits by their enrolled patients. We used this method because the data included repeated measures with errors that were not independent. The unit of analysis was the physician. We performed analyses for all physicians and separately by payment model. First, we performed unadjusted regression analysis of emergency department use per rostered patient on the proportion of virtual visits. We then performed adjusted analyses in which we controlled for all observable physician and practice characteristics, as well as the interaction between month of year and census division. Our data set contained monthly emergency department visits at the physician level across 12 months. Given that emergency department visits are likely correlated for the same physician but independent between different physicians, we used clustered standard errors at the physician level. We conducted all analyses using SAS software version 9.4 (SAS Institute) and Stata version 16 (StataCorp).
We conducted a number of different sensitivity analyses. First, we used the Canadian Triage and Acuity Scale from the National Ambulatory Care Reporting System database for the same time period to provide more information on the type of emergency department visit. Acuity levels are categorized into 5 groups, where level 1 is most urgent and level 5 is least urgent (Appendix 1). We grouped emergency department visits into more acute (level 1, 2 or 3) and less acute (level of 4 or 5) visits, considering that the latter may be a substitute for primary care visits in certain situations. We performed unadjusted and fully adjusted regression models for more acute and less acute visits separately. Second, we ran regressions on emergency department visits with a COVID-19 diagnosis code (080)24 versus those without this code. Third, we stratified the analysis by rurality. Furthermore, we removed inpatient and long-term care visits when calculating the ratio of virtual visits, because these services are not usually delivered virtually, and ran regressions using physician fixed effects. Finally, we extended the data period to Sept. 30, 2021.
Ethics approval
Formal ethics approval was not required because the analysis used deidentified, linked health care administrative data obtained from a data sharing agreement between the Ontario Medical Association and the Ontario Ministry of Health, and the research was initially carried out as part of Ontario Medical Association operations.
Results
Overall, 8078 physicians in family health groups or family health organizations submitted claims from Apr. 1, 2020, to Mar. 31, 2021. We excluded 105 physicians with incomplete roster data and 37 physicians who switched payment models during the study period. We identified 7936 physicians who met the study criteria, including 2458 (31%) physicians in family health groups (enhanced fee-for-service) and 5478 (69%) in family health organizations (blended capitation). Emergency department visits in the claims data for the 2020/21 fiscal year nearly matched total triaged visits in the ambulatory data (Appendix 1).
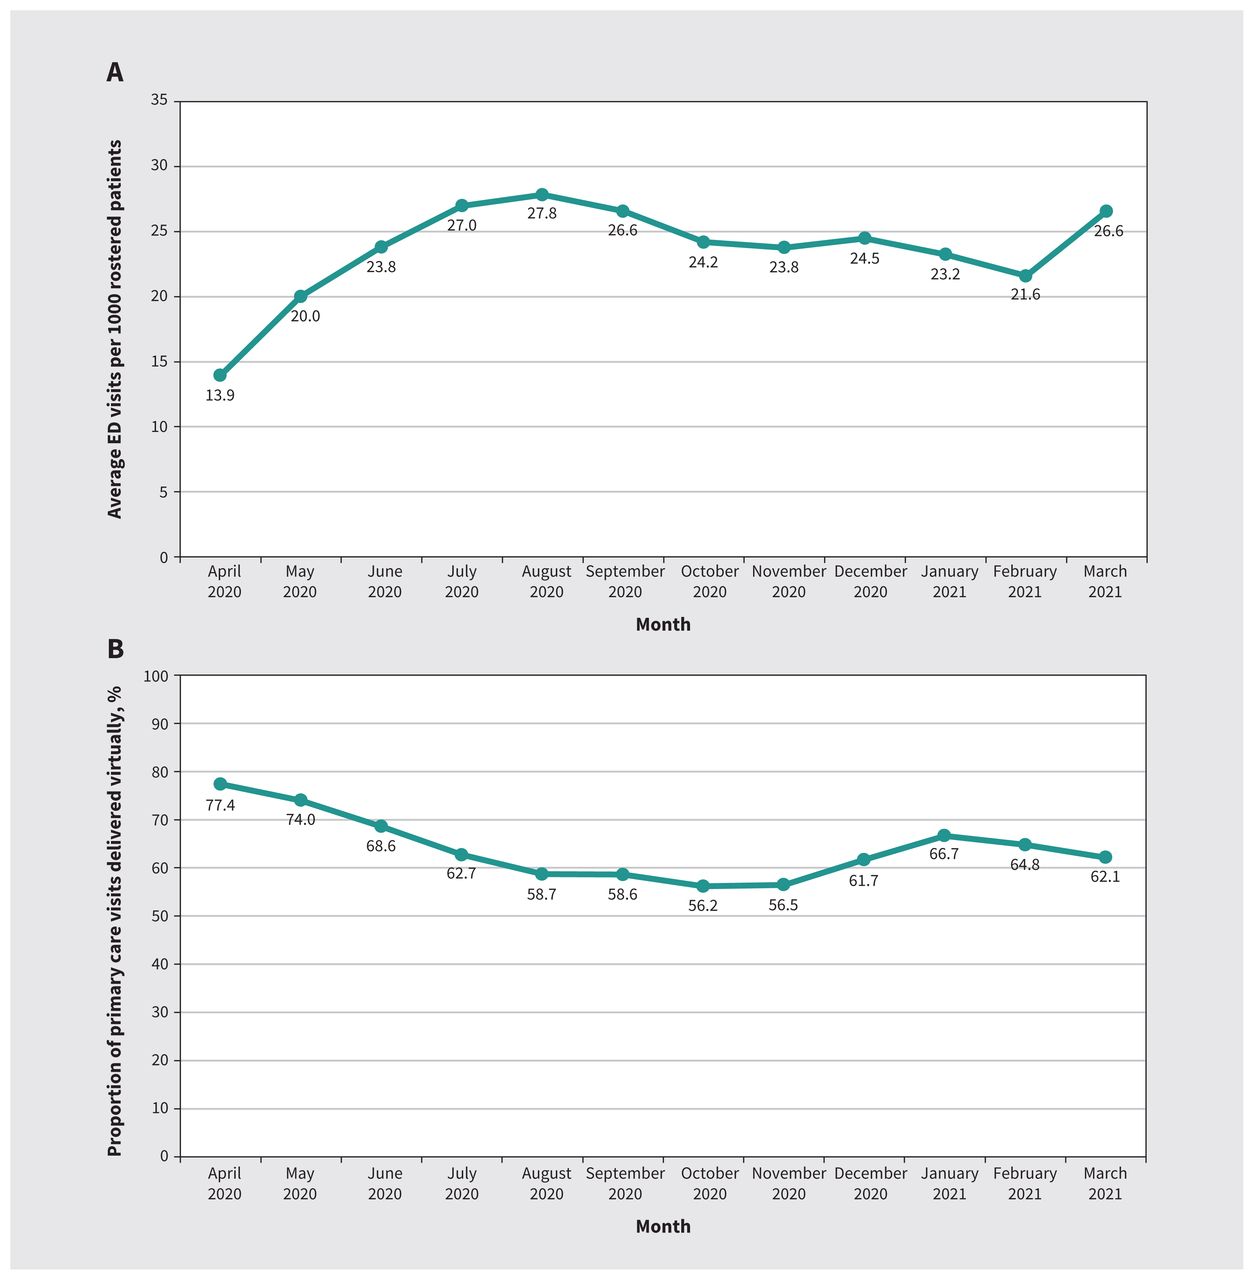
Figure 1 shows trends in monthly emergency department visits and in the proportion of virtual visits. At the onset of the COVID-19 pandemic in spring 2020, and between October 2020 and February 2021, the average number of emergency department visits was low and the proportion of virtual care was high. Trends were similar in both payment models (Appendix 1, Figure A1, Figure A2). Trends in emergency department visits, and in overall primary care visits showed a sharp decline around the beginning of the pandemic, while virtual visits increased (Appendix 1, Figure A3, Figure A4).

Trends in (A) emergency department (ED) visits and (B) proportion of primary care visits delivered virtually by month, April 2020 to March 2021.
The proportion of virtual visits was higher and the number of emergency department visits per rostered patient was lower among female physicians than male physicians, and among physicians in urban areas than those in rural areas (Table 1). Younger physicians had a higher proportion of virtual visits but had around the same number of emergency department visits per rostered patient as older physicians (p = 0.1). Similar patterns were seen for physicians enrolled in family health groups and for those enrolled in family health organizations (Appendix 1, Table A1).
Physician characteristics
In an unadjusted analysis, a 1% increase in the proportion of virtual visits was associated with 11.0 (95% confidence interval 10.1–11.8) fewer emergency department visits per 1000 rostered patients (Table 2). After controlling for all covariates, this association was no longer observed. Results were similar for physicians in the 2 payment models (Appendix 1, Table A2, Table A3). Higher average patient complexity, rurality and male gender were associated with more emergency department visits; older physician age was associated with fewer emergency department visits.
Change in emergency department (ED) visits per 1000 rostered patients
Sensitivity analysis results are presented in Appendix 1. We observed no association between emergency department visits and proportion of virtual care for either high- or low-acuity levels, nor for patients with or suspected to have COVID-19 in an adjusted analysis (Appendix 1, Table A4, Table A5). We did not observe any differences in estimates between non-COVID-19–related emergency department visits and COVID-19–related emergency department visits (Appendix 1, Table A6). Adjusting for covariates separately, estimates in urban, semiurban and rural areas were not statistically significant in adjusted models; comparing estimates across subgroups, the association of the proportion of virtual visits with emergency department visits was not significantly different across subgroups (p = 0.5 urban v. semiurban; p = 0.5 urban v. rural; p = 0.4 semiurban v. rural) (Appendix 1, Table A7). We observed no statistically significant associations between the ratio of virtual visits and emergency department visits after removing inpatient and long-term care visits (Appendix 1, Table A8) or adding physician fixed effects (Appendix 1, Table A9). Extending the data period to Sept. 30, 2021, a 1% increase in the ratio of virtual visits was associated with 1.2 fewer emergency department visits per 1000 rostered patients (Appendix 1, Table A10).
Interpretation
We evaluated the association between the proportion of visits to a physician that were virtual visits and the use of emergency departments by enrolled patients of that physician during the first year of the COVID-19 pandemic. We did not find evidence that enrolled patients substituted emergency department visits because of less availability of in-person care. This finding is important given concerns about virtual care adversely affecting quality of care, leading to calls to substantially reduce care delivered virtually.11–13 In addition to verifying the complete capture of emergency department visits in the claims data by comparing to ambulatory care data, the high shadow-billing premium ensures submission of emergency department billings by non-fee-for-service physicians, supporting the validity of our findings.
It is important to recognize that the impact of the first year of the pandemic on physician practices in Ontario was highly regional and temporal. We controlled for month of year to account for the decline in emergency department use at the beginning of the pandemic, for census division to account for variation in COVID-19 cases (and emergency department use) in different regions of Ontario and for the overall patient complexity composition of a physician’s practice. Some regions may have had more severe shortages of personal protective equipment, which may have restricted in-office visits and increased virtual visits. Similarly, physicians with a more complex patient composition may have had to virtually see their patients more often than physicians with less complex patients. The association is unlikely to be explained by physicians limiting access to in-person care because results were consistent after controlling for total number of visits. Furthermore, the association of a physician’s proportion of virtual visits and emergency department use among enrolled patients was not related to remuneration methods, differences in financial incentives or unmeasured patient complexity between payment models.
Virtual care is now being described as the new normal in Canadian health care.25,26 Future research should consider evaluating the long-term impact of virtual care, and whether it improves appropriate use of emergency departments. Research from the United States suggests that the benefits of telehealth during the pandemic may include expansion of access to care, reduction in disease exposure for health care workers and patients, preservation of supplies of personal protective equipment and reduction in patient demand on facilities.27
Limitations
The findings of this study could be driven by potential confounding by unmeasured patient and physician characteristics. These may include incomplete adjustment for patient complexity and uncaptured differences in patient populations of physicians with a large proportion of virtual care compared with those with smaller proportions, such as differences in technological literacy and levels of anxiety related to in-person care during the first year of the COVID-19 pandemic. Social distancing and fear of contracting SARS-CoV-2, neither of which were measured in our data, could have driven higher levels of virtual care and lower rates of emergency department visits. However, this may be less of a concern in our study because we accounted for monthly and regional variation, and we conducted physician-level analyses. In addition, adjustment for patient complexity was, in part, addressed by using health risk scores and by controlling for emergency department triage and acuity levels. We did not assess other health care settings such as walk-in clinics, and we lacked measures of the quality and modality (e.g., phone or video) of virtual care. We excluded primary care physicians in a purely fee-for-service model, which accounted for about 35% of primary care physicians with virtual visits in the 2020 fiscal year in our data. Finally, results may not be generalizable to the more recent phase of the pandemic or the postpandemic environment, or to other health care settings that are not single-payer systems, that did not experience a large shift in virtual primary care services precipitated by the COVID-19 pandemic or that do not involve relationship-based primary care. These remain important areas for future research.
Conclusion
This study found that a physician’s proportion of virtual care was not associated with increases in the use of emergency departments by enrolled patients during the first year of the COVID-19 pandemic. Future research should focus on evaluating the long-term impact of virtual care on access and quality of patient care and on patient outcomes in different settings.
Footnotes
Competing interests: Nadine Chami, Steve Nastos, Shaun Shaikh, James Wright, Sharada Weir and Jasmin Kantarevic are paid employees of the Ontario Medical Association (OMA). Hemant Shah, Paul Tenenbein, Taylor Lougheed, Nikolina Mizdrak and Patrick Conlon are physician members of the OMA. Hemant Shah reports funding from the Ontario Ministry of Health; consulting fees from Abbvie, Gilead, Lupin and SRx Health; honoraria from Abbvie and Gilead; participation on a data safety monitoring board with Janssen; and participation with the Canadian Association for the Study of Liver. Paul Tenenbein is vice-chair of the Mount Sinai Hospital University Health Network Academic Medical Organization. James Wright reports funding from the Canadian Institutes of Health Research, the United States National Institute for Health and the United Kingdom National Institute for Health Research, as well as consulting fees from the Canadian Medical Protective Association. He is also the chair of the data safety monitoring board for the PERK2 trial. No other competing interests were declared.
This article has been peer reviewed.
Contributors: All of the authors contributed to the conception and design of the work. Nadine Chami and Steve Nastos contributed to the acquisition, analysis, and interpretation of data. Nadine Chami drafted the manuscript. All of the authors revised it critically for important intellectual content, gave final approval of the version to be published and agreed to be accountable for all aspects of the work.
Funding: The authors received no external sources of funding in support of this study.
Data sharing: The data set from this study is held securely at the Ontario Medical Association (OMA) under a data-sharing agreement with the Ontario Ministry of Health that prohibits the OMA from making the data set publicly available.
Disclaimer: The Population Grouping Methodology is owned by the Canadian Institute for Health Information (CIHI) and used under licence. Population-level health care data were obtained from the Ontario Ministry of Health and Long-Term Care (MOHLTC) under an agreement with the Ontario Medical Association (OMA). Both CIHI and the MOHLTC had no involvement in or control over the design and conduct of the study; the collection, analysis and interpretation of the data; the preparation of the data; the decision to publish; or the preparation, review and approval of the manuscript. The opinions expressed in this study are those of the authors and do not necessarily reflect the opinions or views of the OMA or its members.
- Accepted November 17, 2022.
This is an Open Access article distributed in accordance with the terms of the Creative Commons Attribution (CC BY-NC-ND 4.0) licence, which permits use, distribution and reproduction in any medium, provided that the original publication is properly cited, the use is noncommercial (i.e., research or educational use), and no modifications or adaptations are made. See: https://creativecommons.org/licenses/by-nc-nd/4.0/
References
In this issue

Article tools


Jump to section
Related Articles
Cited By...
More in this TOC Section
Similar Articles
Collections


Podcast