


Abstract
Background: Hypoglycemia remains a common life-threatening event associated with diabetes treatment. We compared the risk of first or recurrent hypoglycemia event among metformin initiators who intensified treatment with insulin versus sulfonylurea.
Methods: We assembled a retrospective cohort using databases of the Veterans Health Administration, Medicare and the National Death Index. Metformin initiators who intensified treatment with insulin or sulfonylurea were followed to either their first or recurrent hypoglycemia event using Cox proportional hazard models. Hypoglycemia was defined as hospital admission or an emergency department visit for hypoglycemia, or an outpatient blood glucose value of less than 3.3 mmol/L. We conducted additional analyses for risk of first hypoglycemia event, with death as the competing risk.
Results: Among 178 341 metformin initiators, 2948 added insulin and 39 990 added sulfonylurea. Propensity score matching yielded 2436 patients taking metformin plus insulin and 12 180 taking metformin plus sulfonylurea. Patients took metformin for a median of 14 (interquartile range [IQR] 5–30) months, and the median glycated hemoglobin level was 8.1% (IQR 7.2%–9.9%) at intensification. In the group who added insulin, 121 first hypoglycemia events occurred, and 466 first events occurred in the group who added sulfonylurea (30.9 v. 24.6 events per 1000 person-years; adjusted hazard ratio [HR] 1.30, 95% confidence interval [CI] 1.06–1.59). For recurrent hypoglycemia, there were 159 events in the insulin group and 585 events in the sulfonylurea group (39.1 v. 30.0 per 1000 person-years; adjusted HR 1.39, 95% CI 1.12–1.72). In separate competing risk analyses, the adjusted HR for hypoglycemia was 1.28 (95% CI 1.04–1.56).
Interpretation: Among patients using metformin who could use either insulin or sulfonylurea, the addition of insulin was associated with a higher risk of hypoglycemia than the addition of sulfonylurea. This finding should be considered by patients and clinicians when discussing the risks and benefits of adding insulin versus a sulfonylurea.
Hypoglycemia remains one of the most common medication-related adverse events among patients with diabetes and a leading cause of hospital admissions and emergency department visits.1,2 It is a concern to patients and clinicians and a strong determinant of treatment choices.3 Hypoglycemic medications account for 25% of emergency hospital admissions for adverse drug events among patients aged 65 years and older.2,4 Multiple factors predispose patients with diabetes to hypoglycemia, including older age, polypharmacy, poor nutrition, underlying illness, alcohol use and declining renal function.5,6 Intensive glucose-control treatment for patients with these factors is strongly associated with hypoglycemia.6,7
Consensus statements by major diabetes associations, including the Canadian Diabetes Association, recommend lifestyle modification and metformin as first-line therapies for type 2 diabetes, with the goal of treatment being a glycated hemoglobin (HbA1C) level of 7% or less for many patients.8,9 Multiple options are listed as acceptable add-on treatments. Sulfonylurea is easier to initiate, but insulin dose can be modified in response to daily variation in food intake, exercise or other variables that cause fluctuations in glucose values. Within the Veterans Health Administration clinical practice guideline, both the combination of metformin plus sulfonylurea or the use of bedtime insulin combined with metformin are considered acceptable based on level I evidence.10 To make well-informed decisions about treatment regimens, patients and providers need to understand clinical benefits, such as improvement in microvascular outcomes,11 and harms, such as hypoglycemia.
We recently reported that intensification of metformin with insulin compared with sulfonylurea was associated with an increased risk of all-cause mortality among veterans with diabetes.12 Evidence for a causal relation between hypoglycemia and cardiovascular disease or death is limited, because patients at risk for hypoglycemia also have factors that increase their risk for those outcomes.7,13–15 Both sulfonylurea and insulin are associated with an elevated risk of hypoglycemia compared with metformin.5,7,16–18 We sought to test the hypothesis that using the combination of metformin plus insulin was associated with a greater risk of serious hypoglycemia than using metformin plus sulfonylurea.
Methods
Study design and data sources
We assembled a retrospective cohort of patients whose data were contained in the Veterans Health Administration database.19,20 Data included dispensed prescriptions, date filled, days supplied, and number of pills or vials.21 Demographic data and diagnostic and procedure information identified inpatient and outpatient encounters.22 We collected laboratory results and vital signs data from clinical sources. For patients enrolled in Medicare or Medicaid, we obtained data on enrolment, claims files and prescriptions.23–26 We obtained dates of death from vital status files and the National Death Index.27
The institutional review boards of Vanderbilt University and the Tennessee Valley Healthcare System approved the study.
Study population
The study population comprised veterans aged 18 years and older who received regular care at least once every 180 days for at least 2 years (Appendix 1, Supplemental Figure 1, available at www.cmaj.ca/lookup/suppl/doi:10.1503/cmaj.150904/-/DC1). Metformin initiators were patients who filled a metformin prescription from Oct. 1, 2001, to Sept. 30, 2008, with at least 365 days of baseline data available and without a prescription filled for any diabetic medication within the past 180 days. These patients were eligible for inclusion in the treatment intensification cohort on the date that they filled a prescription for either insulin or sulfonylurea (intensification prescription). We restricted the cohort to patients who were adherent to metformin by excluding patients with no metformin available on the date of their intensification prescription or the prior 180 days. Follow-up began 180 days after the intensification prescription to distinguish patients who continued intensified therapy from those who switched to either insulin or sulfonylurea monotherapy. We excluded patients receiving hospice care or dialysis at the time of intensification.
Exposures
The exposures were insulin (long-acting, premixed or short-/fast-acting insulin) and sulfonylurea (glyburide, glipizide or glimeperide) as add-on therapy to metformin. Follow-up continued through the 181st day without medical contact (inpatient, outpatient or pharmacy use); or nonpersistence, defined as 90 days without metformin or addition of a third antidiabetic drug; an outcome; death; or study end (Sept. 30, 2011). Of our population, 70% received 90-day prescriptions. Prior work has shown that this method yields an average adherence of 80%.28
Outcome
The outcome was a composite of 3 types of hypoglycemia event: hospital admission for hypoglycemia, emergency department visit for hypoglycemia, or outpatient blood glucose level less than 3.3 mmol/L. The outcome was adapted from prior studies evaluating hypoglycemia risks associated with medication use.5,29–31
Hospital admission for hypoglycemia was defined as a primary discharge diagnosis of hypoglycemia or poisoning by insulin or other antidiabetic agents (International Classification of Diseases, 9th Revision [Clinical Modification] code 251.0–251.2, 270.3 or 962.3).5,29 We excluded code 250.3, diabetes with coma, because it can be used for either hyperglycemic or hypoglycemic coma. An emergency department visit for hypoglycemia was defined as an emergency department visit with a compatible coded diagnosis: 251.0–251.2, 270.3, 962.3 or 250.8 but excluding codes 259.8, 272.7, 681.xx, 682.xx, 686.9x, 707.1–707.9, 730.0–730.2, 731.8 or 250.3.30,32 This strategy for identification of hypoglycemia has a positive predictive value of 89% compared with chart review.32 Any outpatient blood glucose or emergency department visit that resulted in hospital admission, within a 48-hour time frame, was counted as a single event following a hierarchy based on health care setting (i.e., outpatient glucose, emergency department and hospital admission). For example, an outpatient blood glucose level of 2.8 mmol/L that resulted in an emergency department visit for hypoglycemia was counted once as an emergency department visit. We also evaluated the risk of recurrent hypoglycemia events (all hypoglycemia events, not just the first one) during study follow-up.
Covariates
Study covariates were collected in the 730 days before intensification and included age, sex, race (white, black or other), fiscal year, indicators of health care use (hospital admission, months from hospital admission to intensification, nursing home use, number of outpatient visits, Medicare or Medicaid use in past year), physiologic variables (body mass index, blood pressure, HbA1C level, low-density lipoprotein level, presence of proteinuria and creatinine, which was used to calculate estimated glomerular filtration rate [eGFR, using the Chronic Kidney Disease Epidemiology Collaboration formula]),33 duration of monotherapy before intensification of treatment (diabetes duration), selected medications, smoking and presence of comorbidities (Appendix 1, Supplemental Table 1).
For missing covariates, we conducted multiple imputation using the Markov Chain Monte Carlo method and a noninformative Jeffreys prior.34 All covariates from the primary analysis, survival time and a censoring indicator were included in 20 imputation models and used to compute final estimates.
Statistical analysis
The primary analysis investigated the risk of hypoglycemia first events and recurrent events (all events) in propensity score–matched cohorts. The propensity score modelled the probability of use of metformin plus insulin, given covariates and service network of care. Because of size differences between the 2 groups, observations of metformin plus insulin were matched to observations of metformin plus sulfonylurea using a 1:5 optimal matching algorithm35,36 (Appendix 1, Supplemental Table 2 and Supplemental Figure 2). We used Cox proportional hazards models to compare outcomes for metformin plus insulin versus metformin plus sulfonylurea (reference) in the matched cohorts adjusted for covariates with robust standard errors to account for multiple events within patients. Our second analysis used a competing risk model, in which hypoglycemia competes with the risk of death. The evaluation of recurrent hypoglycemic events used the mean cumulative count method in the presence of a competing risk.37 The proportional hazards assumptions were verified through examination of log–log plots.
We conducted sensitivity analyses to determine the robustness of our findings. First, we used the intensification regimen to define drug exposure and ignored any subsequent changes in regimens or the 90-day refill requirement (persistent exposure not required). Lack of censoring for nonpersistence increased follow-up and events. Second, in the cohort construction, we were interested in long-term outcomes, cardiovascular disease and death; therefore, follow-up began 180 days post–treatment intensification to minimize exposure misclassification. To evaluate early effects of intensification, we performed an alternate analysis using a new-user design, in which follow-up began at intensification and continued through the first 180 days.38,39 Third, we re-analyzed the data using the composite of hospital admission or emergency department visits for hypoglycemia or outpatient blood glucose level less than 2.8 mmol/L, outcome definitions similar to those used in previous clinical trials.7,40 We also conducted analyses including only events that resulted in emergency department visit or hospital admission. Furthermore, we conducted subgroup analyses stratifying by age (< 65 or ≥ 65 yr), baseline eGFR (< 60 mL/min or ≥ 60 mL/min) and hospital admission in the 90 days before intensification (yes or no). Finally, we stratified the reference group by sulfonylurea type and assessed the effect of insulin compared with either glyburide or glipizide and glimepiride. Analyses were conducted using R41,42 and SAS version 9.2.
Results
Study cohort and patient characteristics
Among 178 341 metformin initiators, 52% (n = 92 045) did not intensify treatment during follow-up (median 50, interquartile range [IQR] 19–67, mo); 6% (n = 9851) stopped metformin; and 2% (n = 3577) had less than 6 months of follow-up. Among the remaining 72 868 (41%) of metformin initiators who started another treatment, 29 523 (40%) were excluded because their regimen excluded metformin or included nonstudy medications.
Of the 72 868 metformin initiators, 59% (n = 43 345) intensified treatment with insulin or sulfonylurea. We excluded less than 1% (n = 407) with data errors (n = 370) or codes indicating hospice care (n = 0) or dialysis (n = 37). Of the remaining 42 938 patients, the cohort included 2948 (7%) patients who added insulin (47% long-acting, 22% both long- and short-acting, 17% premixed, 11% short-acting) and 39 990 (93%) patients who added a sulfonylurea (55% glipizide, 43% glyburide, 2% glimepiride) (Figure 1). After 1:5 propensity score matching, our study included 14 616 patients; 2436 patients were taking metformin plus insulin, and 12 180 were taking metformin plus sulfonylurea. Characteristics between the matched groups were similar (Table 1).
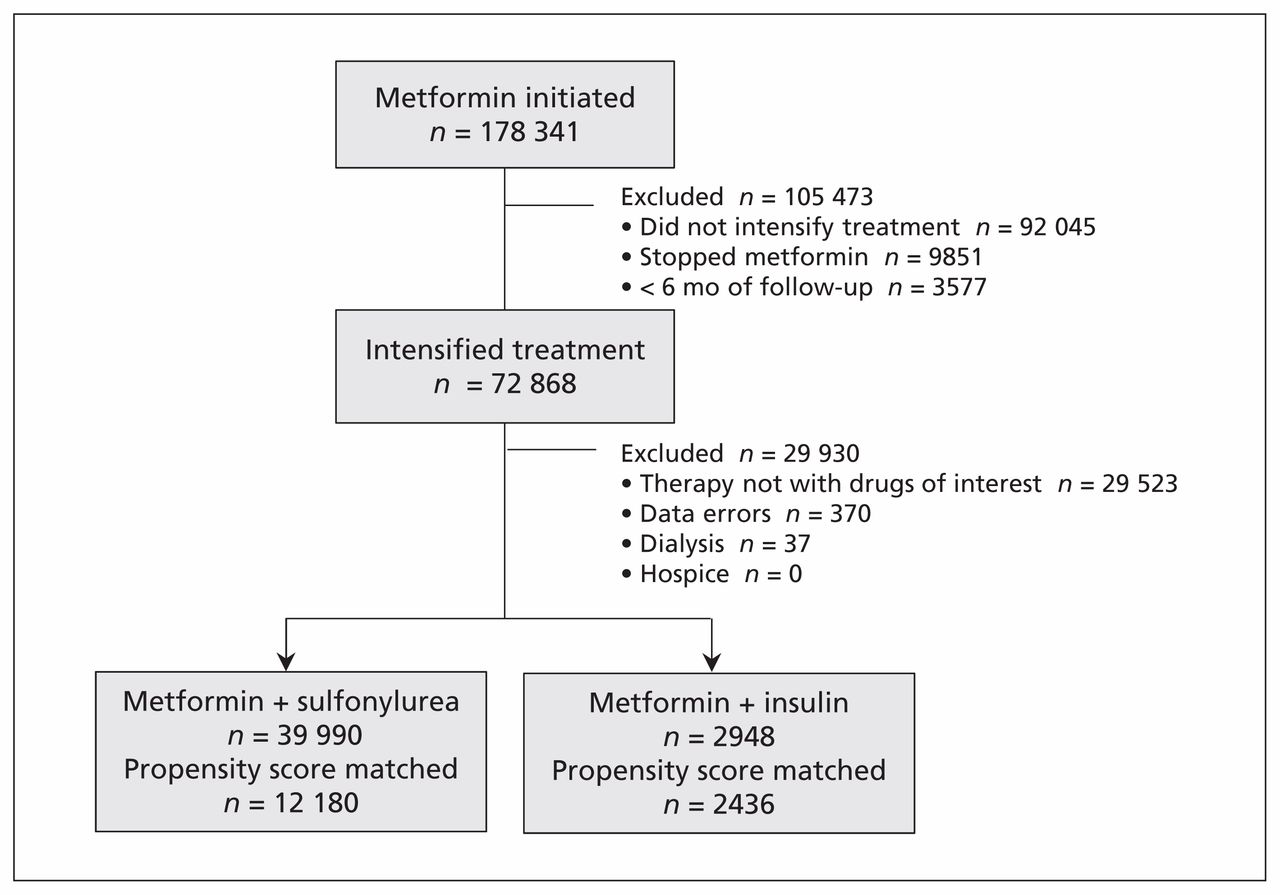
Flow of eligible participants.
Characteristics of patients in the propensity score–matched cohort*
Reasons for censoring were treatment change (57.0% metformin plus insulin v. 60.8% metformin plus sulfonylurea), no health care contact (1.3% v. 2.5%), study end (31.3% v. 29.4%) or death (5.5% v. 3.5%). The median follow-up prior to censoring or reaching the first outcome was 1.1 (IQR 0.5–2.3) years among patients taking metformin plus insulin and 1.1 (IQR 0.5–2.2) years among patients taking metformin plus sulfonylurea (p = 0.2). The median follow-up when considering recurrent events was 1.2 (IQR 0.5–2.4) years among patients taking metformin plus insulin and 1.2 (IQR 0.5–2.3) years among patients taking metformin plus sulfonylurea (p = 0.1). The median number of outpatient blood glucose tests per patient during follow-up was 3 (IQR 1–7) among patients taking metformin plus insulin versus 3 (IQR 1–6) among patients taking metformin plus sulfonylurea (p = 0.9).
Time to first or recurrent hypoglycemia event
Among patients who intensified their treatment with insulin, 121 first hypoglycemia events occurred (24 hospital admissions and emergency visits, and 97 events with an outpatient glucose level < 3.3 mmol/L). In the group who intensified their treatment with sulfonylurea, 466 events occurred (105 hospital admissions and emergency visits, and 361 events with an outpatient glucose level < 3.3 mmol/L). This yielded 30.9 versus 24.6 hypoglycemia events per 1000 person-years, respectively (adjusted hazard ratio [HR] 1.30, 95% confidence interval [CI] 1.06–1.59) (Table 2, Figure 2A). Allowing for recurrent hypoglycemia, 159 hypoglycemic events occurred (32 hospital admissions and emergency visits, and 127 glucose levels < 3.3 mmol/L) among patients taking metformin plus insulin, and 585 events occurred (125 hospital admissions and emergency visits, and 460 glucose levels < 3.3 mmol/L) among those taking metformin plus sulfonylurea. Event rates were 39.1 and 30.0 per 1000 person-years, respectively (adjusted HR 1.39, 95% CI 1.12–1.72) (Table 2, Figure 2B). We evaluated median HbA1C levels at the start of follow-up and over time. HbA1C levels declined to a median of 7.3% (IQR 6.5%–8.5%) among patients taking metformin plus insulin, which was comparable with the median level among patients taking metformin plus sulfonylurea (7.2%, IQR 6.5%–8.2%). HbA1C levels remained similar between the two groups over follow-up (Figure 2). The separate analysis of the risk of first hypoglycemia accounting for the competing risk of death showed similar results (adjusted HR 1.28, 95% CI 1.04–1.56).
Risk of hypoglycemic event among patients taking metformin plus insulin versus metformin plus sulfonylurea in the propensity score–matched cohort
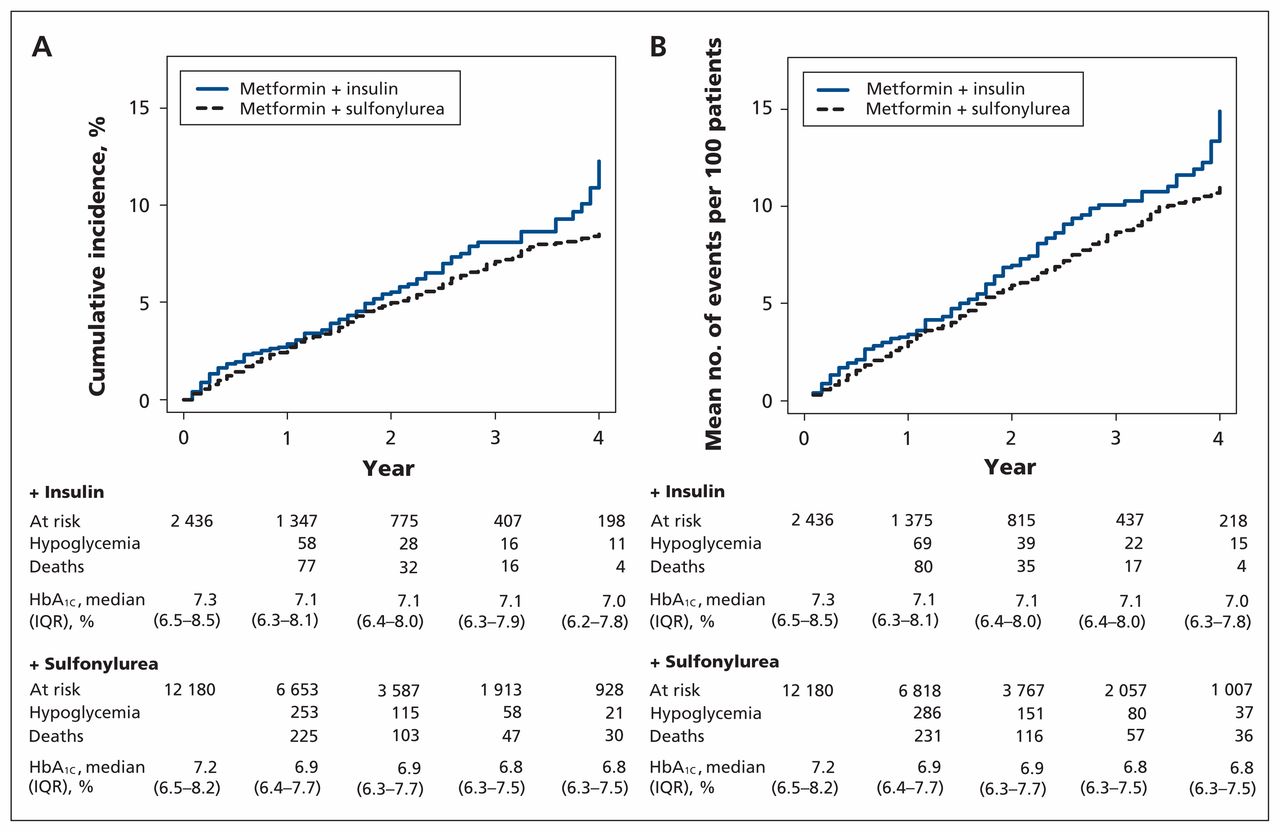
Cumulative incidence plots for risk of first hypoglycemic event (A) and mean cumulative counts for recurrent hypoglycemic event (B) among patients taking metformin plus insulin and patients taking metformin plus sulfonylurea. Note: HbA1C = glycated hemoglobin, IQR = interquartile range.
Sensitivity and subgroup analyses
In sensitivity analyses in which patients remained in their original exposure group (persistent exposure was not required), there were 261 first hypoglycemia events among patients who intensified their treatment with insulin and 1016 first events among those who intensified their treatment with sulfonylurea, yielding 36.9 and 28.1 events per 1000 person-years (adjusted HR 1.34, 95% CI 1.17–1.54). When evaluating the risk of recurrent events, there were 448 and 1470 events, yielding 58.5 and 38.4 events per 1000 person-years among patients taking metformin plus insulin versus patients taking metformin plus sulfonylurea, respectively (adjusted HR 1.58, 95% CI 1.32–1.89) (Table 2).
In the primary analyses, follow-up began 6 months before treatment intensification to ensure that patients were intensifying rather than switching therapies. In an alternate analysis that evaluated the first 6 months following medication initiation, there were 5647 insulin initiators and 62 472 sulfonylurea initiators. Some of these patients switched to single-agent insulin or sulfonylurea, or discontinued their medication use. After 1:5 propensity score matching, there were 4793 and 23 965 patients (Appendix 1, Supplemental Table 4). Those who initiated insulin versus sulfonylurea had 57.0 versus 40.7 first events per 1000 person-years (adjusted HR 1.36, 95% CI 1.12–1.66). Recurrent event rates were 63.6 versus 44.9 per 1000 person-years, respectively (adjusted HR 1.37, 95% CI 1.12–1.69). Sensitivity analyses that varied the outcome definition were consistent with our main findings (Appendix 1, Supplemental Table 5 and Supplemental Figure 3). Subgroups stratified by age, eGFR or hospital admission in the 90 days before treatment intensification demonstrated consistent results with no evidence of effect modification. Results were also consistent when patients taking glyburide or glipizide and glimepiride were used as reference (Figure 3; Appendix 1, Supplemental Table 6).
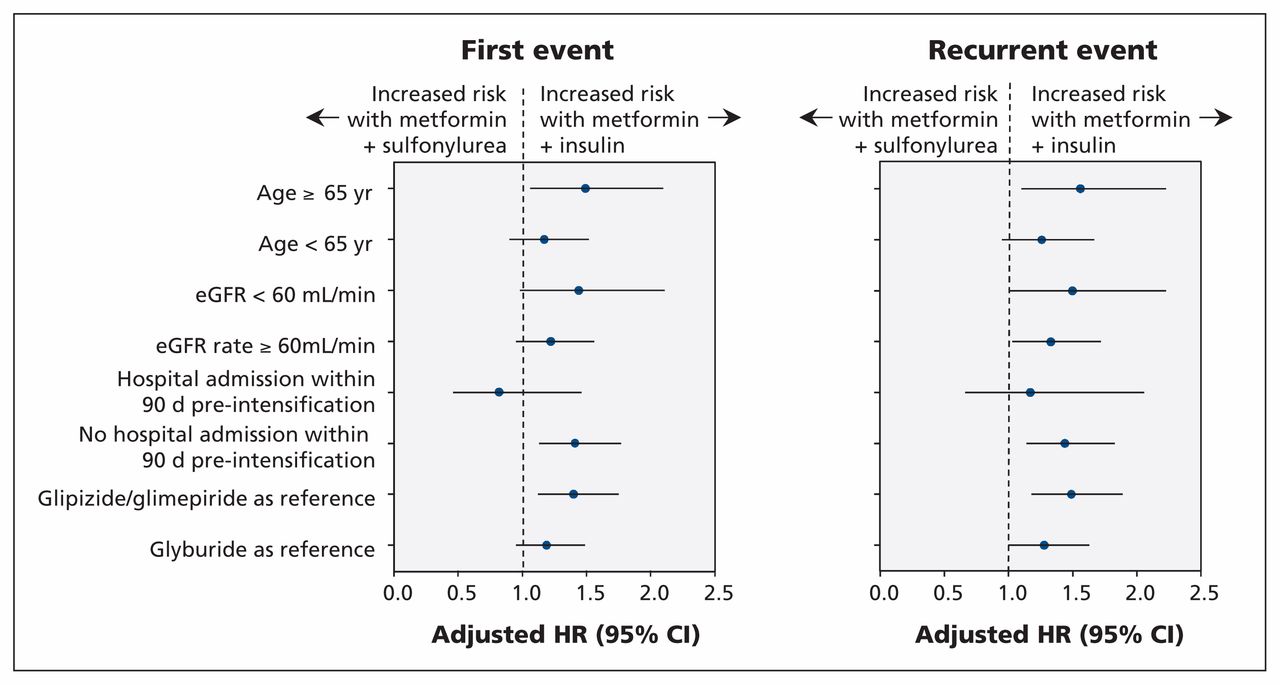
Adjusted hazard ratio for risk of first hypoglycemic event and recurrent hypoglycemic event among subgroups. Values above 1.0 indicate an increased risk with metformin plus insulin. Note: CI = confidence interval, eGFR = estimated glomerular filtration rate, HR = hazard ratio.
Interpretation
In a national cohort of veterans with diabetes intensifying their metformin treatment, we found that among those who could use either medication, the addition of insulin versus sulfonylurea to metformin was associated with an increased risk of hypoglycemia. Our group recently reported that adding insulin versus sulfonylurea to metformin was associated with an increased risk of all-cause mortality in this same cohort (adjusted HR 1.44, 95% CI 1.15–1.79).12 Although the current study does not clarify whether that increased mortality is related to hypoglycemia, this study provides more evidence of the increase in adverse outcomes among patients who add insulin versus sulfonylurea. By design (i.e., propensity score matching), our study focused on patients for whom either drug would be considered appropriate (HbA1C level < 10%). Results from this study would allow those patients and their providers to make informed decisions about drug choice for intensification. The high rate of documented hypoglycemia also serves as a reminder to individualize HbA1C targets, with higher targets for older patients and those with factors that increase hypoglycemia risk.43,44
A systematic review and meta-analysis of glyburide versus other secretagogues and insulin on hypoglycemia risk included 21 randomized trials and 7047 patients followed from 4 weeks to 10 years.45 The hypoglycemia risk associated with glyburide was higher compared with other sulfonylureas (HR 1.83, 95% CI 1.35–2.49), but not different from insulin (HR 0.88, 95% CI 0.25–3.06). Consistent with the meta-analytic results, our estimate of hypoglycemia appeared higher when insulin was compared with glipizide and glimepiride versus glyburide.
There was no difference in HbA1C levels over follow-up between those who intensified with insulin versus sulfonylurea (Figure 2), which suggests that the outcome differences were not due to large between-group differences in glycemic targets. A systematic review that included 5 trials of intensive versus conventional glucose control reported a twofold risk of hypoglycemia in patients who received intensive treatment intensification.6 The largest was the Action to Control Cardiovascular Risk in Diabetes (ACCORD) trial. About 77% of patients in the intensive therapy group received insulin versus 55% in the standard group.46 The trial was stopped owing to higher mortality in the intensive therapy group. With outcomes adjudication, 42 of 431 deaths were adjudicated to be probably, possibly or definitely related to hypoglycemia (27 intensive v. 15 standard).40,47 So, although there was an increase in deaths in the intensive therapy arm, recognized hypoglycemia represented a minority of the deaths. In a follow-up to the Action in Diabetes and Vascular Disease (ADVANCE) trial, Zoungas and colleagues7 noted that, of 11 140 patients who completed a median follow-up of 5 years, 2.1% reported severe hypoglycemia. The proportion who died was 19.5% versus 9.0% among those who did not report hypoglycemia (adjusted HR 2.69, 95% CI 1.97–3.67). However, that secondary analysis did not determine whether hypoglycemia was causal or a marker of illness severity.
In our cohort, patients with reduced renal function, those aged 65 years and older and those with a recent hospital admission had high rates of hypoglycemia, with rates including recurrent hypoglycemia of 4 to 5 per 100 person-years of follow-up. Some have advocated using insulin without dose reduction for patients with chronic kidney disease stages 3 to 5.48 Although insulin or glipizide remains a treatment mainstay for patients with chronic kidney disease, caution in dosing remains necessary because of the risk of hypoglycemia from prolonged insulin clearance.31,49 Similarly, older age is a risk for hypoglycemia, and higher HbA1C targets are acceptable among older adults. HbA1C targets should be individualized to account for age, comorbidities and life expectancy.50
Limitations
Our study has several limitations. First, although we used multiple strategies to address confounding by indication and disease severity, including selecting patients adherent to metformin at intensification, matching propensity scores and adjusting covariates, residual confounding from difficult to measure factors, such as patient frailty, remains possible. Second, we did not account for medication doses or concurrent medication use that may increase hypoglycemia risk. Third, veterans may not receive all their care or medications in veteran facilities,24,25 which may result in missing outcomes or medications, which we partially addressed through supplementation with Medicare and Medicaid data. We also chose to combine substantial hypoglycemia with low outpatient glucose measurements, which may be symptomatic or asymptomatic. We did not quantify the patient-level impact of those low glucose values. Fourth, to reduce exposure misclassification, we started follow-up 6 months after intensification. Although this approach excluded the initial study regimen exposure period, a separate sensitivity analysis evaluated hypoglycemia in the first 6 months following regimen intensification with similar results. Finally, our population reflects a typical veteran population; therefore, caution is warranted when extrapolating our findings to other settings.
Conclusion
In our study, the addition of insulin to metformin monotherapy was associated with a higher risk of hypoglycemia than the addition of sulfonylurea. This finding, in combination with our previous finding of increased risk of death, should be considered by patients and clinicians when discussing the risks and benefits of adding insulin versus a sulfonylurea. This result also calls into question the apparent equivalence of these choices in current guidelines.
Footnotes
Competing interests: Christianne Roumie, Adriana Hung and Tom Elasy report grants from Veterans Affairs Clinical Science Research and Development. Jea Young Min reports grants from the National Center for Advancing Translational Sciences. Marie Griffin reports grants from the Agency for Healthcare Research and Quality and MedImmune. No other competing interests were declared.
This article has been peer reviewed.
Contributors: Christianne Roumie, Robert Greevy, Carlos Grijalva, Adriana Hung, Tom Elasy and Marie Griffin designed the study. Jea Young Min contributed to the conception and design of the study. Christianne Roumie, Robert Greevy, Xulei Liu and Marie Griffin conducted the study and collected data. Robert Greevy and Xulei Liu performed the analysis. Christianne Roumie drafted the manuscipt, which all of the authors revised. All of the authors gave final approval of the version to be published and agreed to act as guarantors of the work.
Funding: This project was funded by the Veterans Affairs Clinical Science Research and Development investigator-initiated grant CX000570-01 (Roumie). Christianne Roumie and Tom Elasy were supported in part by the Centers for Diabetes Translation Research grant P30DK092986. Jea Min was supported by a Clinical and Translational Science Award (TL1TR000447-08) from the National Center for Advancing Translational Sciences. Dr. Hung was supported by a VA Career Development Award (2-031-09S). Support for Veterans Affairs/Centers for Medicare & Medicaid Services data was provided by the Department of Veterans Affairs, Veterans Affairs Health Services Research and Development Service, Veterans Affairs Information Resource Center (project nos. SDR 02-237 and 98-004).
- Accepted October 27, 2015.
References
In this issue

Article tools


Jump to section
Related Articles
Cited By...
More in this TOC Section
Similar Articles

