


Article Figures & Tables
Figures
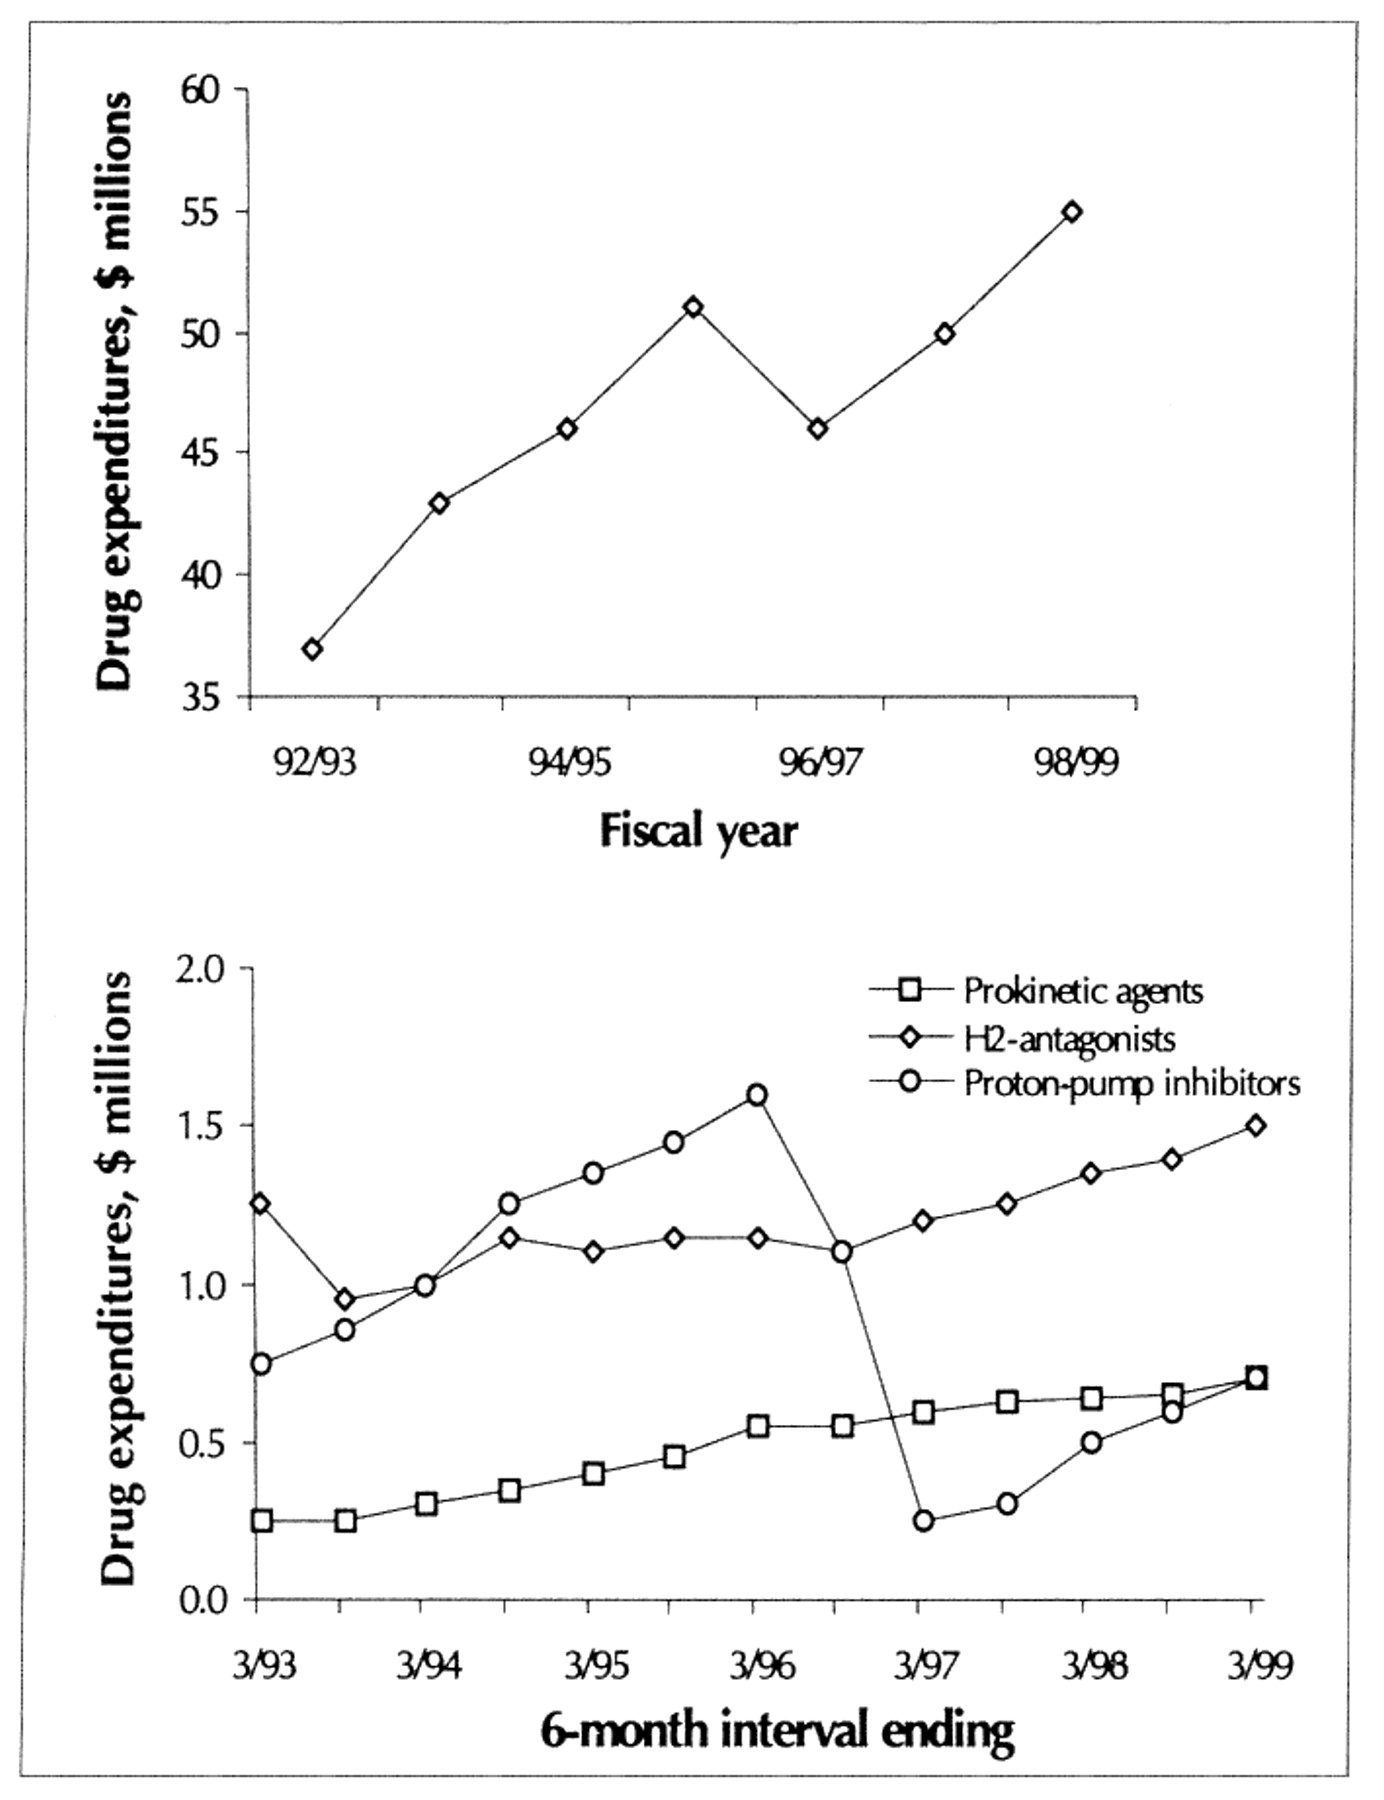
Fig. 1: Top: Total drug expenditures in Newfoundland and Labrador from 1992/93 to 1998/99. Bottom: Expenditures for drugs to treat upper gastrointestinal disorders, in 6-month intervals from March 1993 to March 1999.
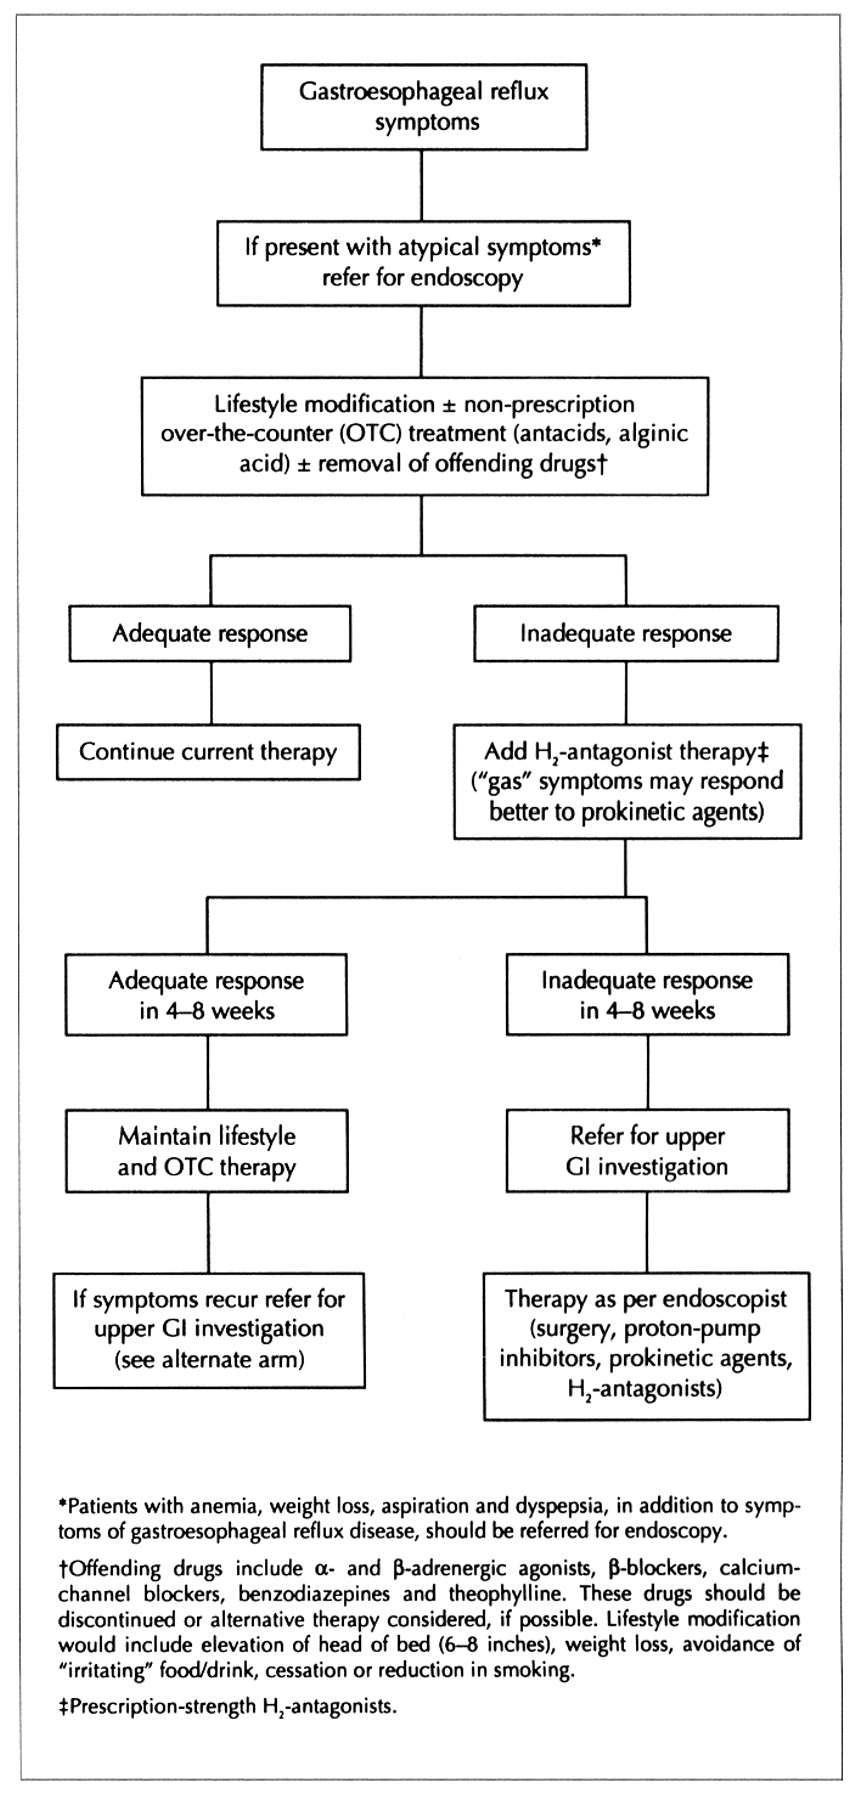
Appendix 2: Algorithm for the management of gastroesophageal reflux disease.
Appendix 3: Algorithm for the management of dyspepsia.


Tables
Table 1: Approvals for proton-pump inhibitor therapy in Newfoundland and Labrador from July 1 to Dec. 31, 1996


In this issue
Article tools
Respond to this article


Jump to section
Related Articles
Cited By...
More in this TOC Section
Similar Articles
Collections

