


Article Figures & Tables
Figures
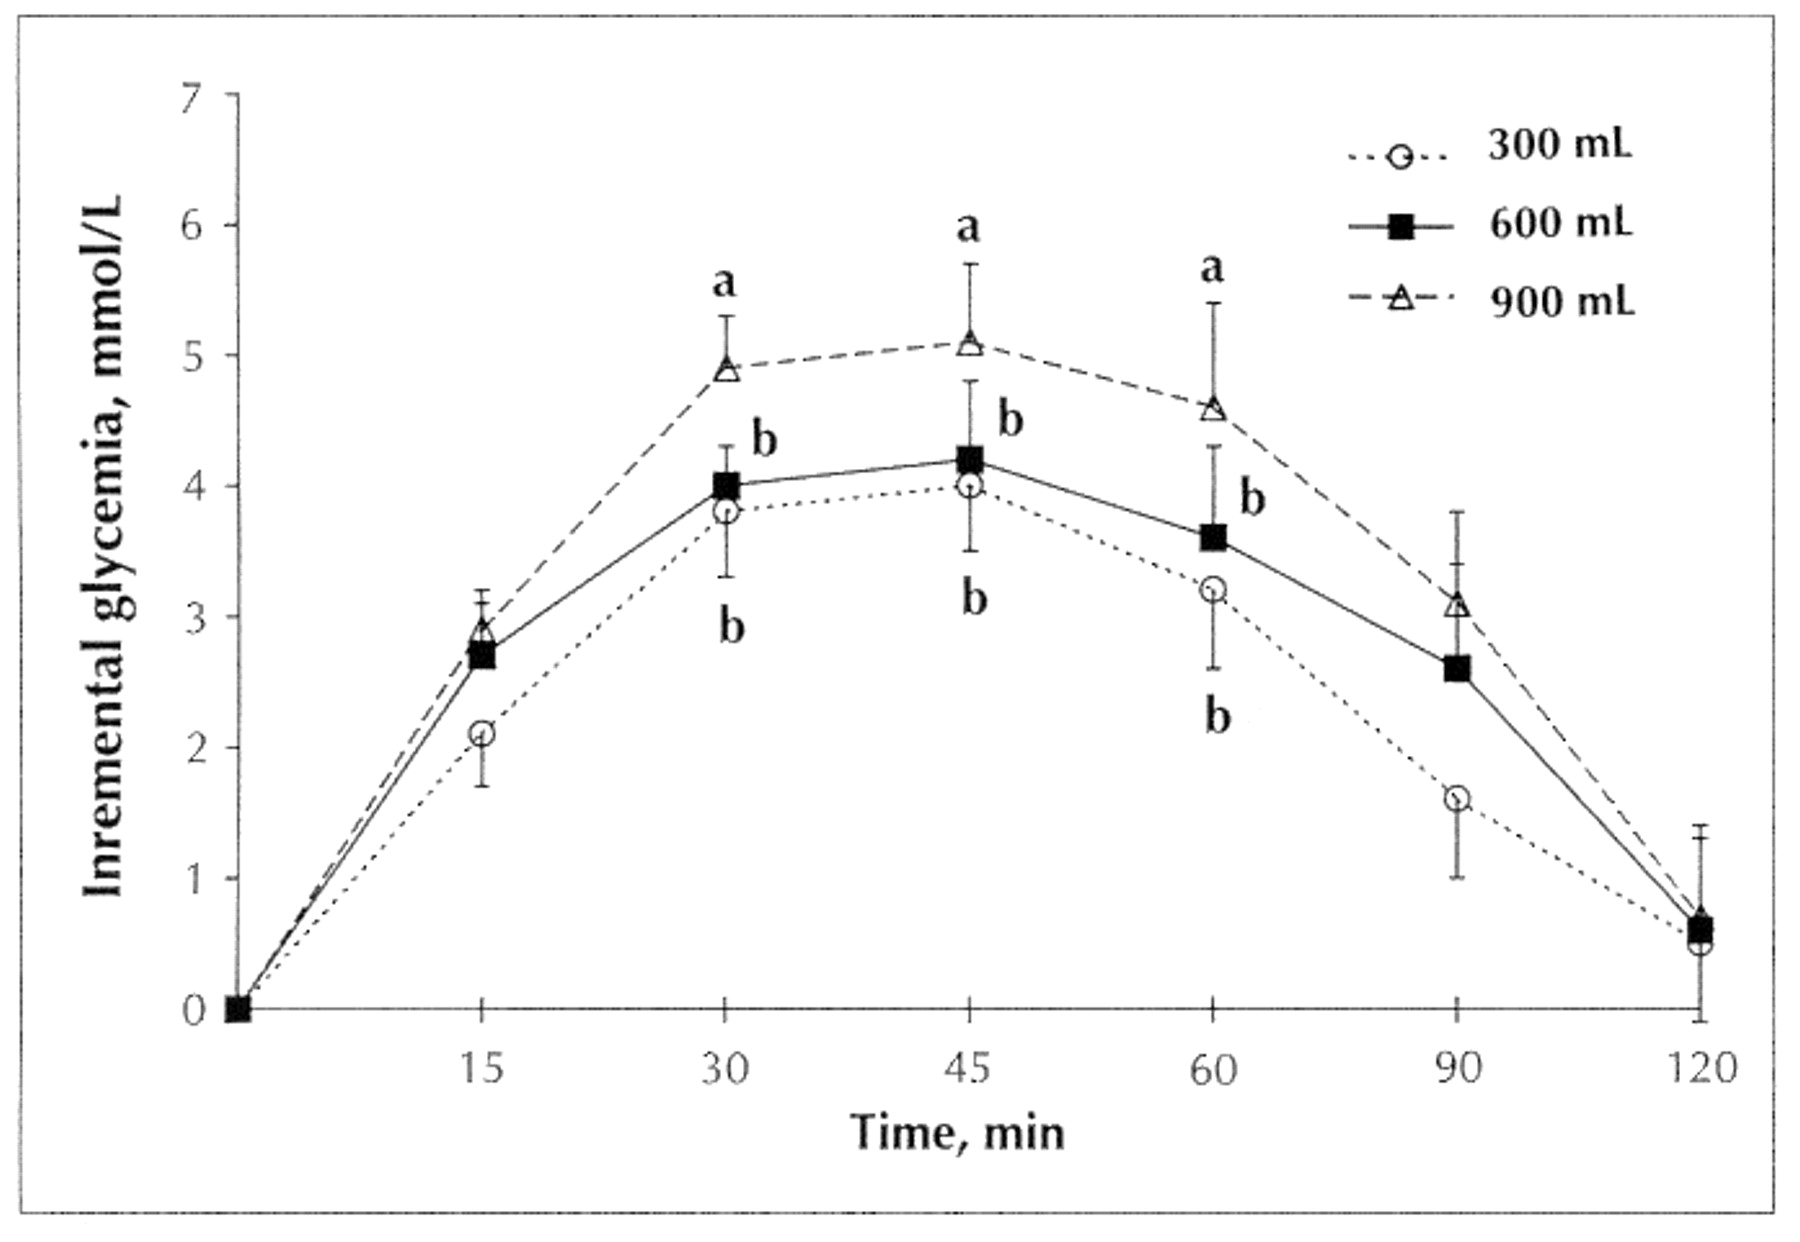
Fig. 1: Glycemic responses to 75-g oral glucose tolerance test at 300 mL, 600 mL and 900 mL over time in 10 subjects with previously undiagnosed dysglycemia. Values are means and standard errors of the means; different letters indicate a significant difference between treatments (p < 0.05).
Fig. 2: Comparison of the positive incremental area under the blood glucose curve for the 300-mL, 600-mL and 900-mL volume doses of a 75-g oral glucose tolerance test. Values are means and standard errors of the means; different letters indicate a significant difference between treatments (p < 0.05).

Tables
Table 1: Indices of blood glucose following a 75-g oral glucose tolerance test at 3 treatment dilutions


In this issue
Article tools
Respond to this article


Jump to section
Related Articles
Cited By...
More in this TOC Section
Similar Articles
Collections

