


Article Figures & Tables
Figures
Fig. 1: Regression lines for body mass index on age (7–19 years) from 3 national surveys for males and females. CFS = Canada Fitness Survey,14 CSWB = Campbell's Survey on the Well-being of Canadians,13 NLSCY = National Longitudinal Survey of Children and Youth.17
Fig. 2: Prevalence of overweight (>> 85th age- and sex-specific percentile) and obesity (>> 95th age- and sex-specific percentile) using the 1981 CFS data14 as baseline for boys and girls aged 7–13 years.


Tables
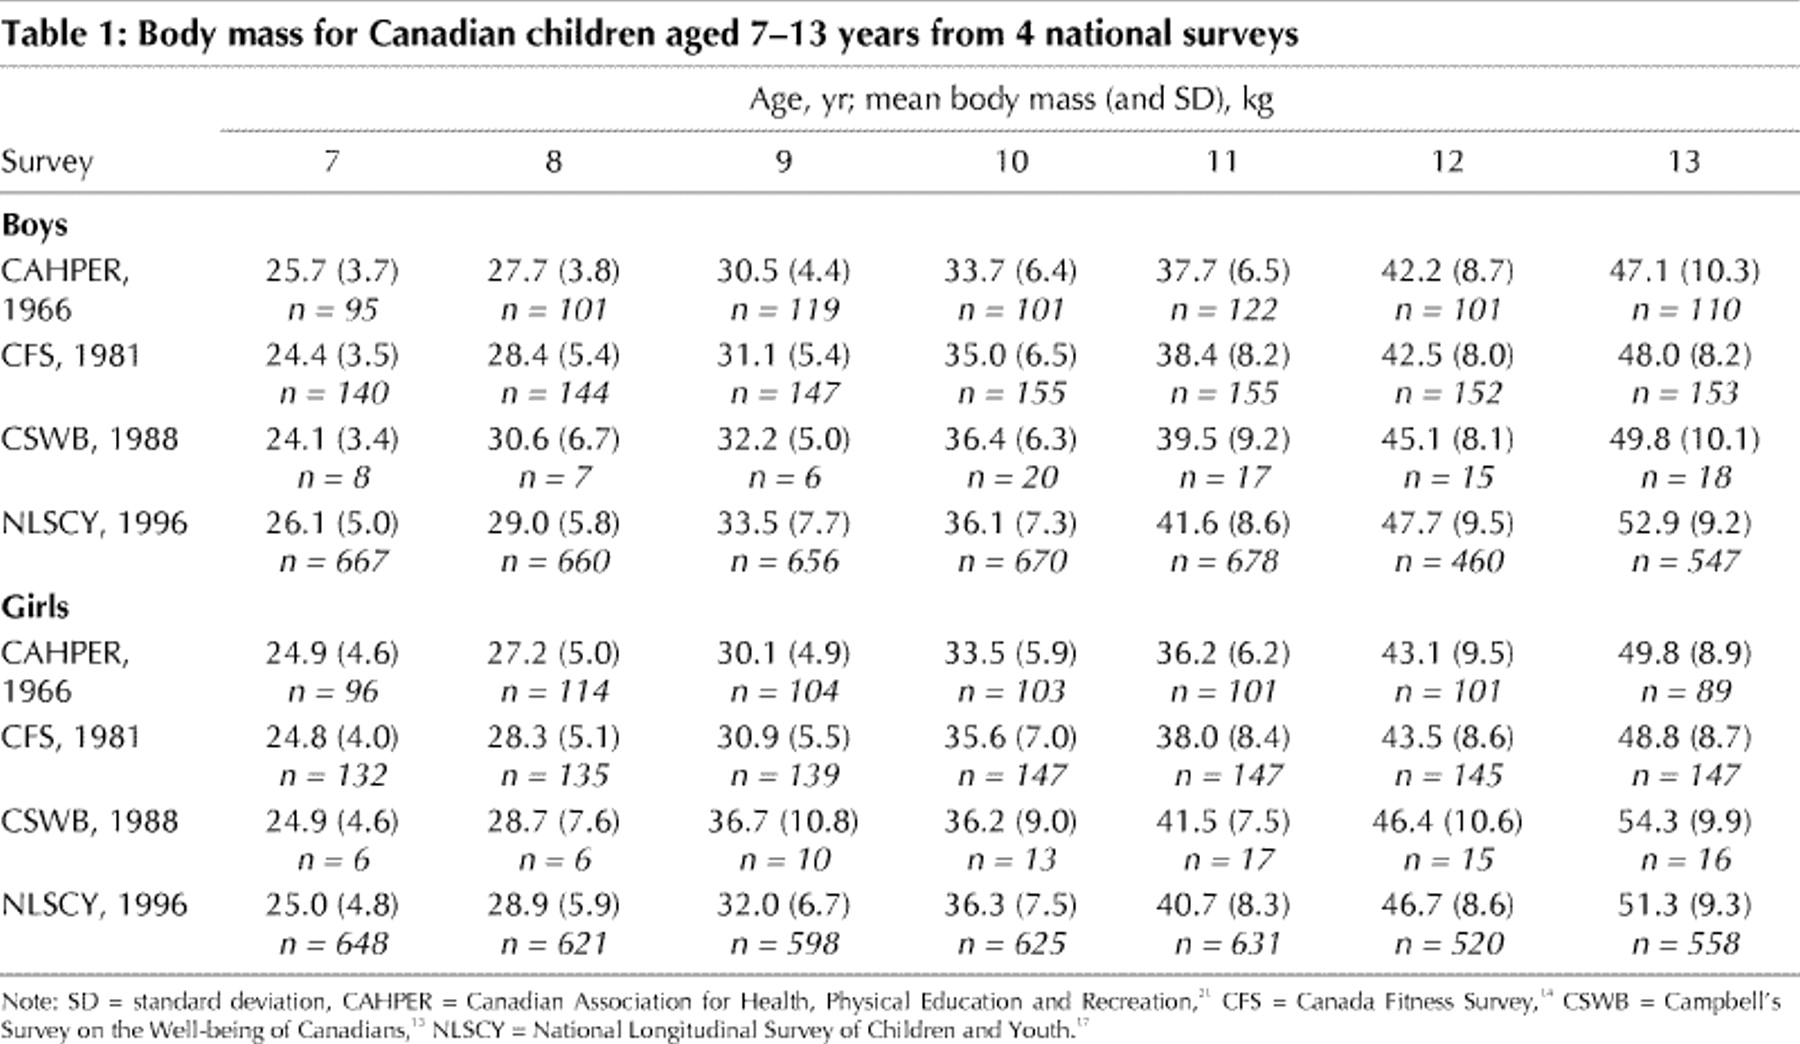
Table 1.

In this issue
Article tools
Respond to this article


Jump to section
Related Articles
Cited By...
- Incidence and prevalence of MS in children: A population-based study in Ontario, Canada
- Examining the social determinants of children's developmental health: protocol for building a pan-Canadian population-based monitoring system for early childhood development
- A changing pattern of childhood BMI growth during the 20th century: 70 y of data from the Fels Longitudinal Study
- Hypertension in children: new trends and challenges
- Vitamin D Status Is Modestly Associated with Glycemia and Indicators of Lipid Metabolism in French-Canadian Children and Adolescents
- Effect of school-based physical activity interventions on body mass index in children: a meta-analysis
- A comprehensive view of sex-specific issues related to cardiovascular disease
- Prevalence of and risk factors for childhood overweight and obesity
- Blood Pressure and Adiposity in Children and Adolescents
- Distribution of Fasting Plasma Insulin, Free Fatty Acids, and Glucose Concentrations and of Homeostasis Model Assessment of Insulin Resistance in a Representative Sample of Quebec Children and Adolescents
- Disordered eating attitudes and behaviours in teenaged girls: a school-based study
- Correction
- The spread of the childhood obesity epidemic
More in this TOC Section
Similar Articles

