


Article Figures & Tables
Figures
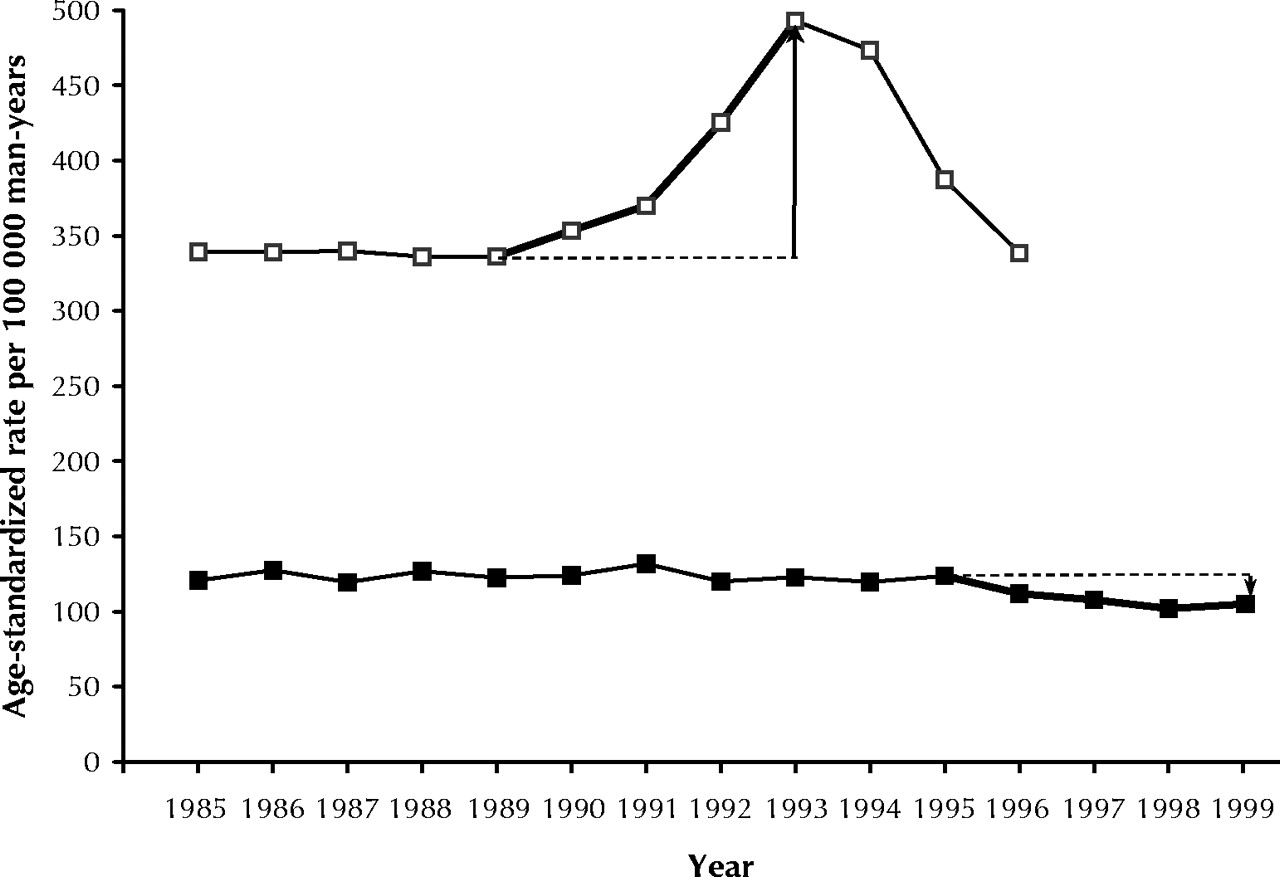
Fig. 1: Age-standardized incidence rates (white squares) and mortality rates (black squares) for prostate cancer among men in Quebec, aged 50–85 years.
Fig. 2: (A) Relative differences between observed and expected prostate cancer 1993 incidence rates (incidence difference) (white bars) and relative differences between observed and expected prostate cancer 1999 mortality rates (mortality difference) (black bars) for each birth cohort (born from 1914/15 to 1942/43). (B) Scatter plot of the incidence differences and the mortality differences in the 15 birth cohorts. The numbers in the figure correspond to the last 2 digits of the years of birth of the men in each cohort (e.g., 22–23 refers to the cohort of men born in 1922/23 and therefore aged 70–71 years in 1993 and 76–77 years in 1999). Weighted Pearson's product-moment correlation coefficient = 0.33 (1-sided p = 0.89)
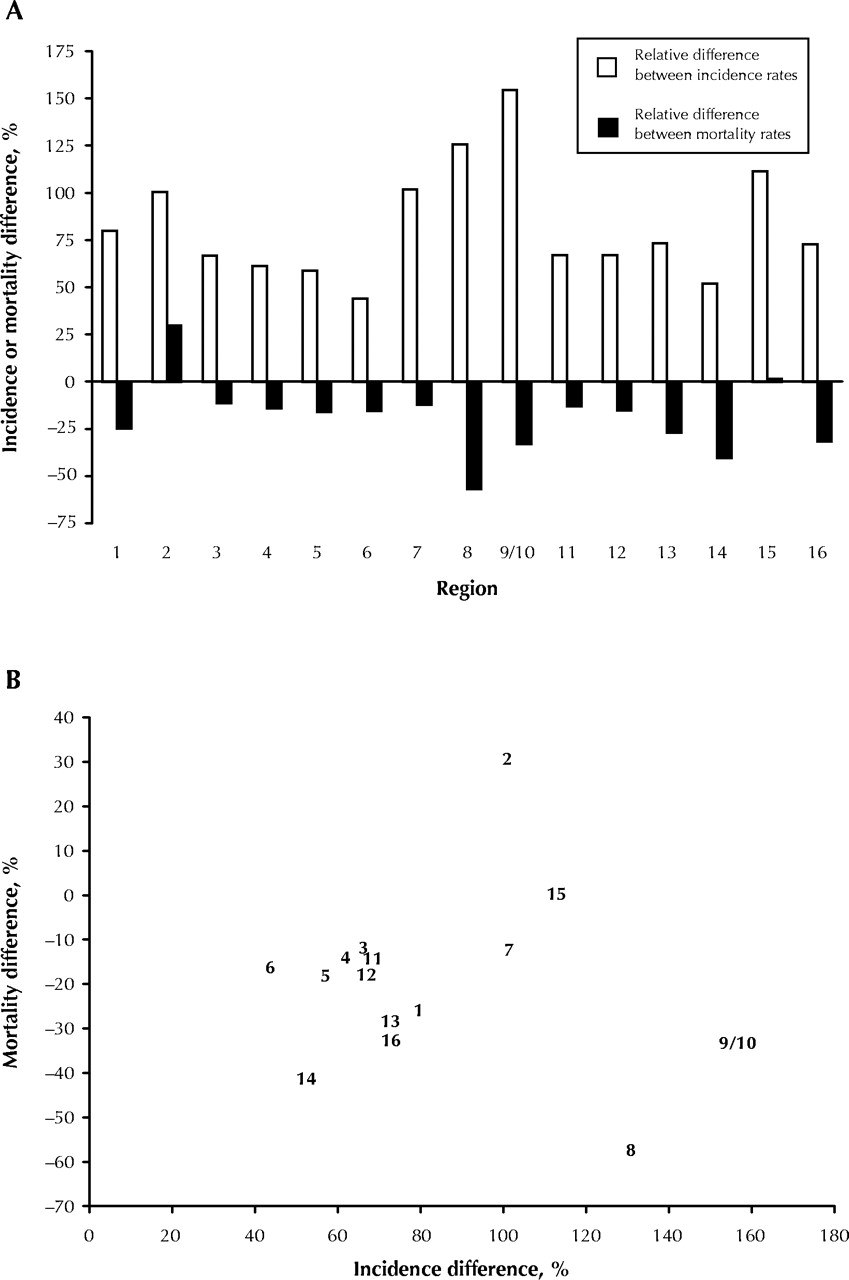
Fig. 3: (A) Relative differences between 1993 and mean 1986/89 age-standardized prostate cancer incidence rates (incidence difference) (white bars) and relative differences between 1999 and mean 1992/95 age-standardized prostate cancer mortality rates (mortality difference) (black bars) for each region. Codes for regions: 1 Bas St-Laurent; 2 Saguenay; 3: Quebec City; 4 Mauricie et Centre-du-Québec; 5 Estrie; 6 Montreal; 7 Outaouais; 8 Abitibi; 9/10 Côte-Nord and Nord-du-Québec; 11 Gaspésie; 12 Chaudière-Appalaches; 13 Laval; 14 Lanaudière; 15 Laurentides; 16 Montérégie. Weighted Pearson's product-moment correlation coefficient = 0.13 (1-sided p = 0.68). (B) Scatter plot of the incidence differences and the mortality differences in the 15 regions. The numbers in the figure correspond to the Quebec regions as outlined above.


In this issue
Article tools


Jump to section
Related Articles
Cited By...
- Recommendations on screening for prostate cancer with the prostate-specific antigen test
- Trends in prostate cancer incidence and mortality: an analysis of mortality change by screening intensity
- PSA screening: correlating noise with noise?
- Interpreting the Quebec prostate cancer study
- PSA screening: correlating noise with noise?
- Does PSA screening reduce prostate cancer mortality?
More in this TOC Section
Similar Articles
Collections

