


Article Figures & Tables
Figures
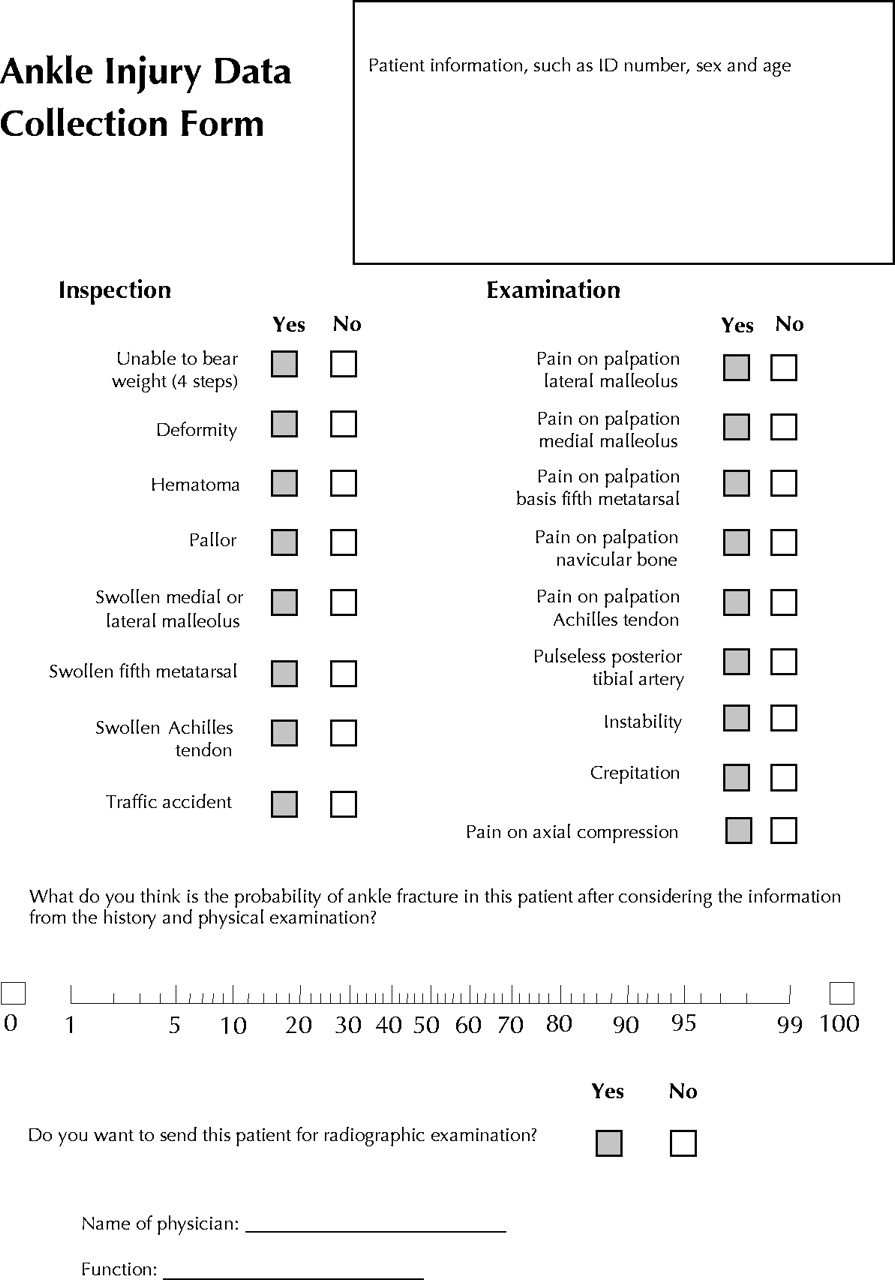
Fig. 1: Structured data collection form encompassing variables from the Ottawa ankle rules (Table 1), the Leiden ankle rule (Table 2) and other variables from the history and physical examination. Pallor = a noticeable difference in skin colour compared with the contralateral side; pulseless or weakened posterior tibial artery = a marked difference from the contralateral side; pain on axial compression = pain when plantar pressure is applied on the heel in the direction of the knee. [The form is a translation of a Dutch original.]
Fig. 2: Distribution of patients. Patients were excluded for the following reasons: age less than 18 years (29 patients), referred by another hospital or a general practitioner (4), pregnant (3), reason for exclusion unknown (3), injured more than 5 days before (2), lack of insurance (1) and head injury (1). The following types of fracture were observed: fracture of fifth metatarsal (16 cases), Weber B fracture (8), trimalleolar fracture (7), Weber A fracture (7), Weber C fracture (7), fracture of calcaneus (6), fracture of cuboid (6), fracture of medial malleolus (5), bimalleolar fracture (3), avulsion fracture of fibula (3), fracture of talus (3), fracture of navicular bone (1), fracture of first to fourth metatarsal (1), and Volkmann fracture (1). Fractures are defined as follows: Weber A — fibular fracture distal from the tibiofibular syndesmosis; Weber B — fibular fracture at the level of the tibiofibular syndesmosis; Weber C — fibular fracture proximal of the tibiofibular syndesmosis; and Volkmann – triplane fracture of dorsal tibia. A clinically significant fracture was defined as an apparent dislocation of more than 2 mm and a fracture line more than 3 mm across.
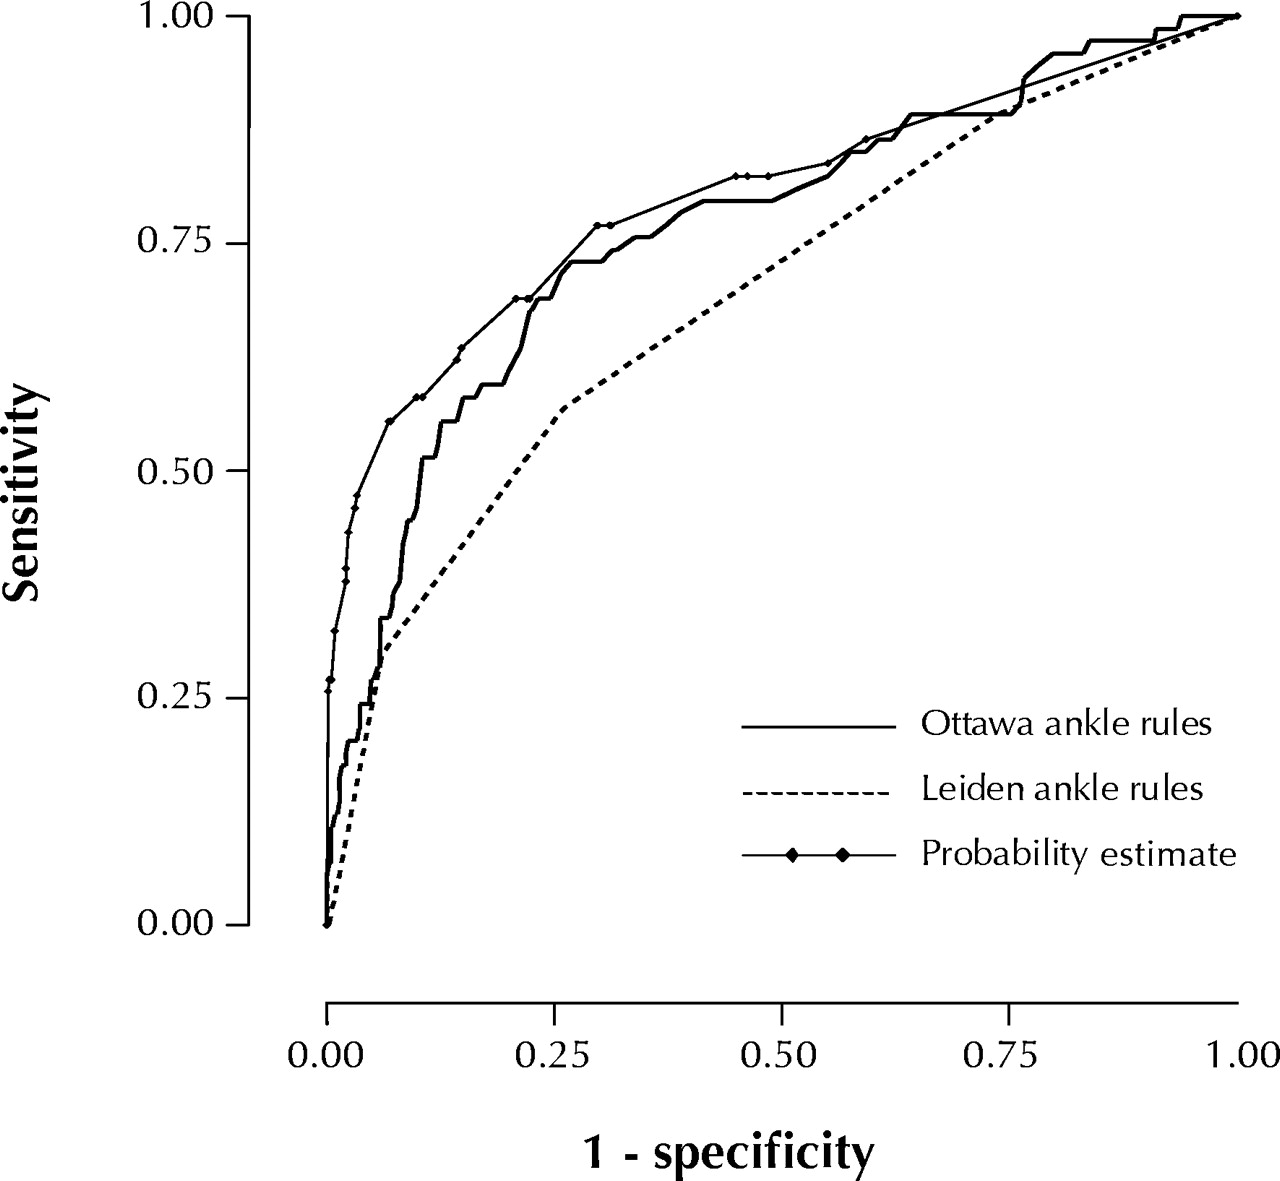
Fig. 3: Receiver operating characteristic curves for the 2 sets of ankle rules and the probability estimates for physicians' judgement. The area under these curves expresses the performance of a diagnostic tool in distinguishing patients with the target condition from those without it for all possible cutoff values. The AUC can be interpreted as the probability that a test correctly ranks two individuals, of which one has the disease and ond does not have the disease. The AUC takes values between 0 and 1, with higher values indicating better overall performance.
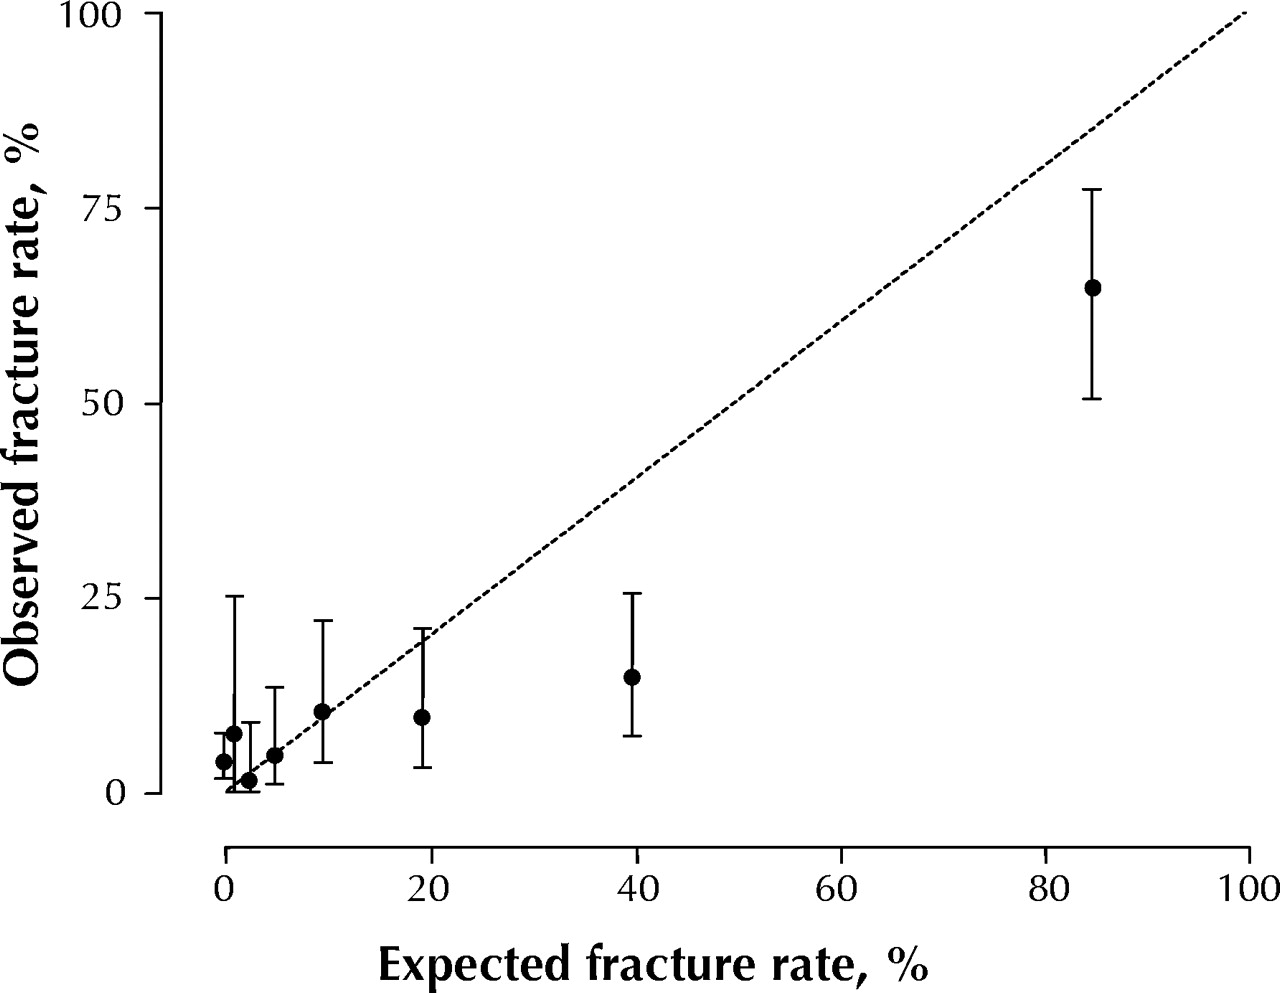
Fig. 4: Calibration curve comparing physicians' performance in diagnosing ankle fracture with observed fractures. The probability estimates for physicians' judgement were divided into 10 deciles, and the actual fracture rate in each decile was compared with the mean probability estimate for all patients in the decile. The first point (probability estimate of zero) covers 3 deciles (a total of 243 patients). For each point estimate, the 95% confidence interval is given. The dashed line indicates perfect calibration between observed fractures and physicians' diagnostic performance.


Tables
Table 1.

Table 2.
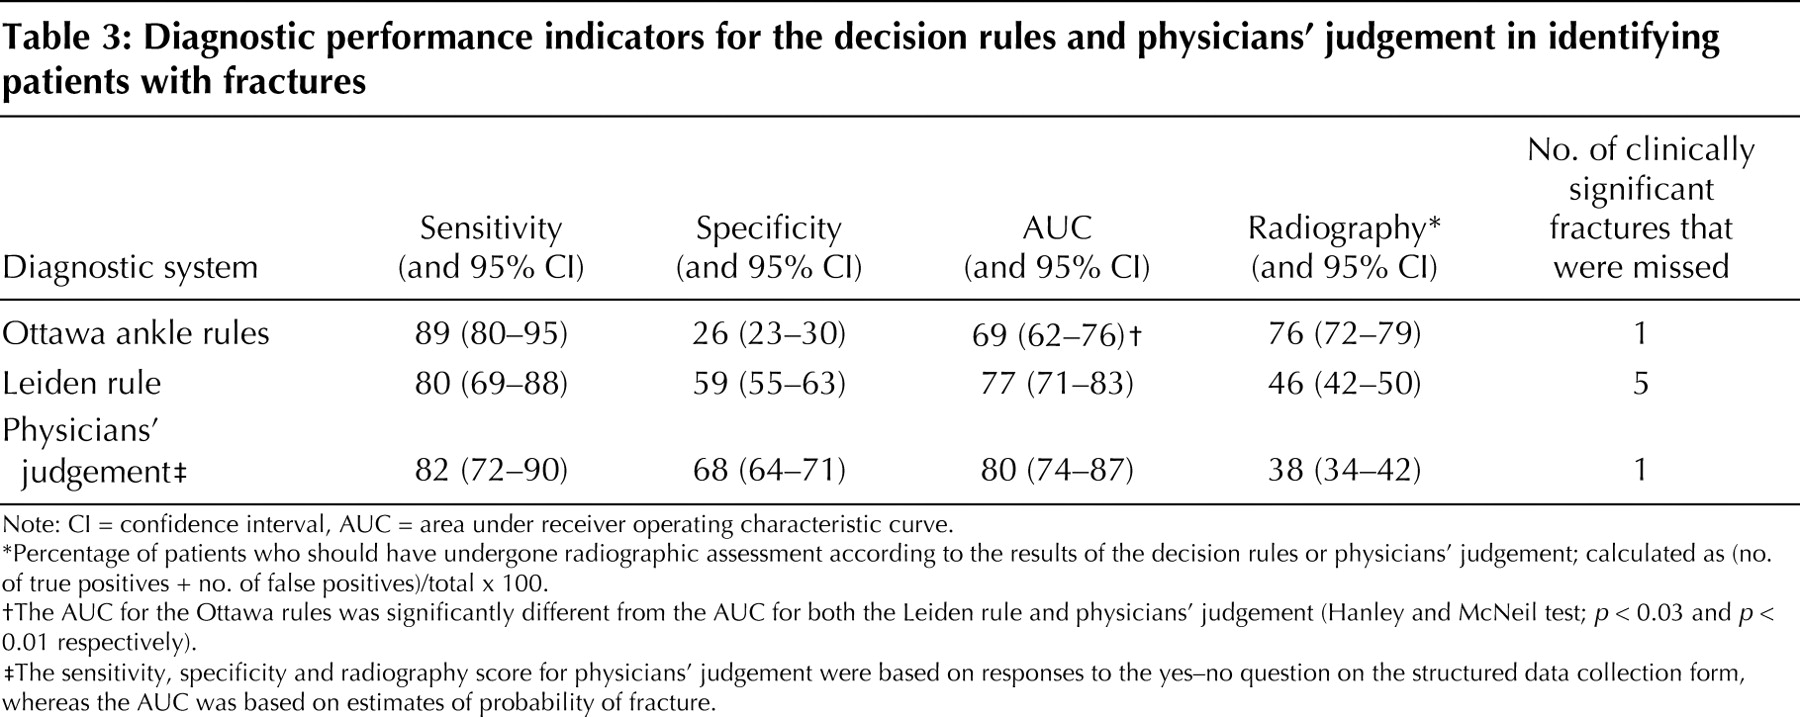
Table 3.


In this issue
Article tools


Jump to section
Related Articles
Cited By...
- Diagnostic accuracy of the Ottawa Ankle and Midfoot Rules: a systematic review with meta-analysis
- Does a decision aid help physicians to detect chronic obstructive pulmonary disease?
- Diagnostic classification in patients with suspected deep venous thrombosis: physicians' judgement or a decision rule?
- Practical Implementation of a Multiplex PCR for Acute Respiratory Tract Infections in Children
- Accuracy of Ottawa ankle rules to exclude fractures of the ankle and mid-foot: systematic review
More in this TOC Section
Similar Articles
Collections

