


Article Figures & Tables
Figures
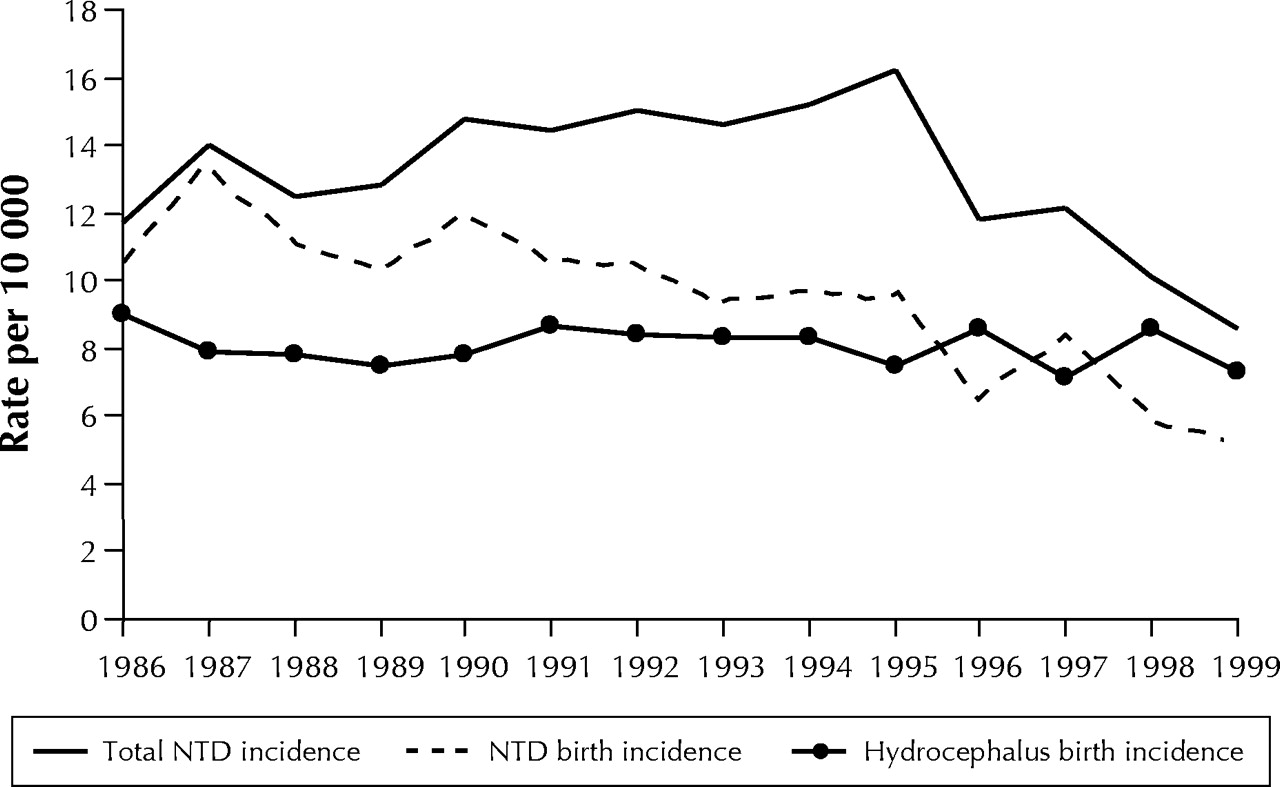
Fig. 1: Total incidence rates of neural tube defects (NDTs) and birth incidence rates of NTDs and hydrocephalus in Ontario, 1986–1999.
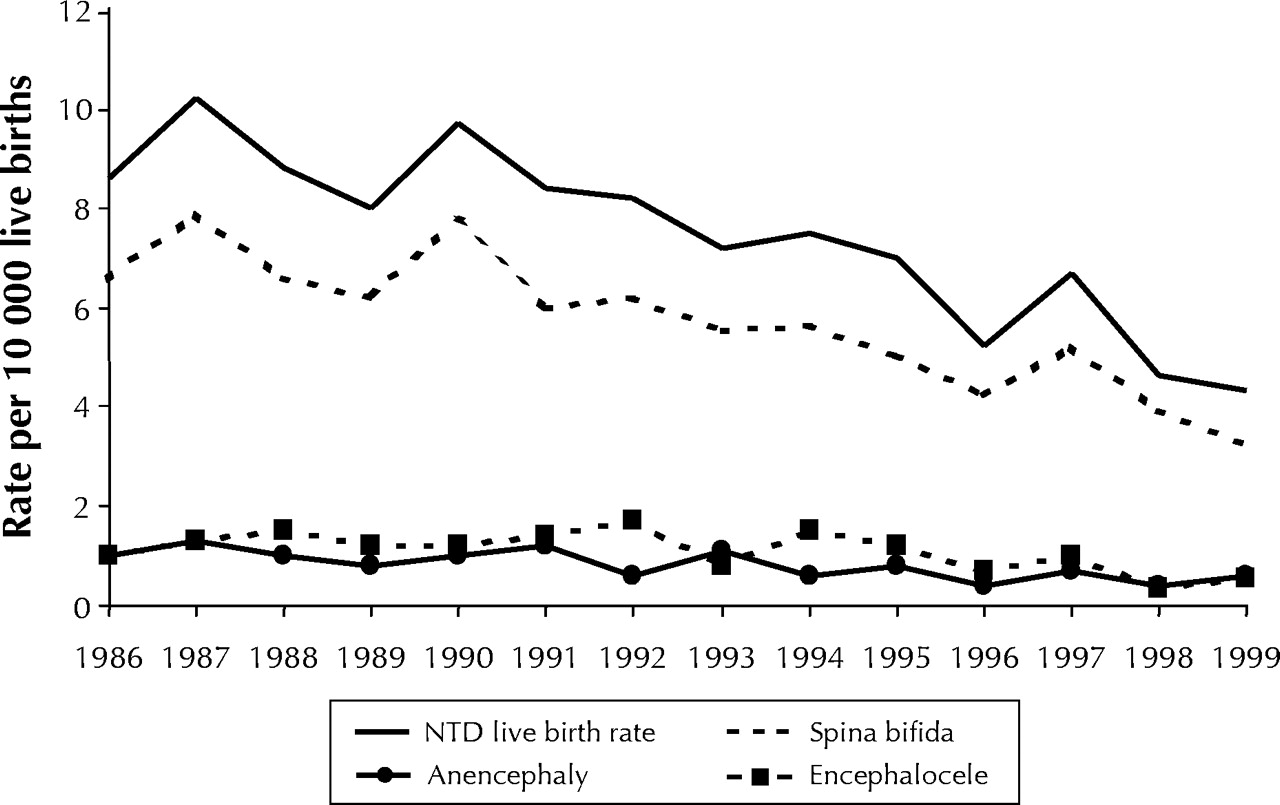
Fig. 2: Incidence rates of NTDs in live births, by type of NTD.
Fig. 3: Incidence rates of NTDs in stillbirths, by type of NTD.
Fig. 5: Distribution of live births, stillbirths and therapeutic abortions with NTDs.
Fig. 4: Incidence rates of NTDs or hydrocephalus in therapeutic abortions.


Tables
Appendix 1.


In this issue
Article tools
Respond to this article


Jump to section
Related Articles
Cited By...
- Parity and the use of folic acid supplementation during pregnancy
- Fortification and Health: Challenges and Opportunities
- Folate bioavailability: implications for establishing dietary recommendations and optimizing status
- Folic Acid Supplementation and Cancer Risk: Point
- Very Low Oral Doses of Vitamin B-12 Increase Serum Concentrations in Elderly Subjects with Food-Bound Vitamin B-12 Malabsorption
- Folate supplementation: too much of a good thing?
- Trends in Serum Folate, RBC Folate, and Circulating Total Homocysteine Concentrations in the United States: Analysis of Data from National Health and Nutrition Examination Surveys, 1988-1994, 1999-2000, and 2001-2002
- Will mandatory folic acid fortification prevent or promote cancer?
- Role of Folate in Colon Cancer Development and Progression
- Folic Acid Supplements and Fortification Affect the Risk for Neural Tube Defects, Vascular Disease and Cancer: Evolving Science,
- Neural tube defects and periconceptional folic acid
More in this TOC Section
Similar Articles

