


Article Figures & Tables
Figures
Fig. 1: Relative change (1985 = 1.0) in age-standardized incidence and mortality of prostate cancer in British Columbia from 1985 to 1999 among men aged 50–74 and among those 75 and older.
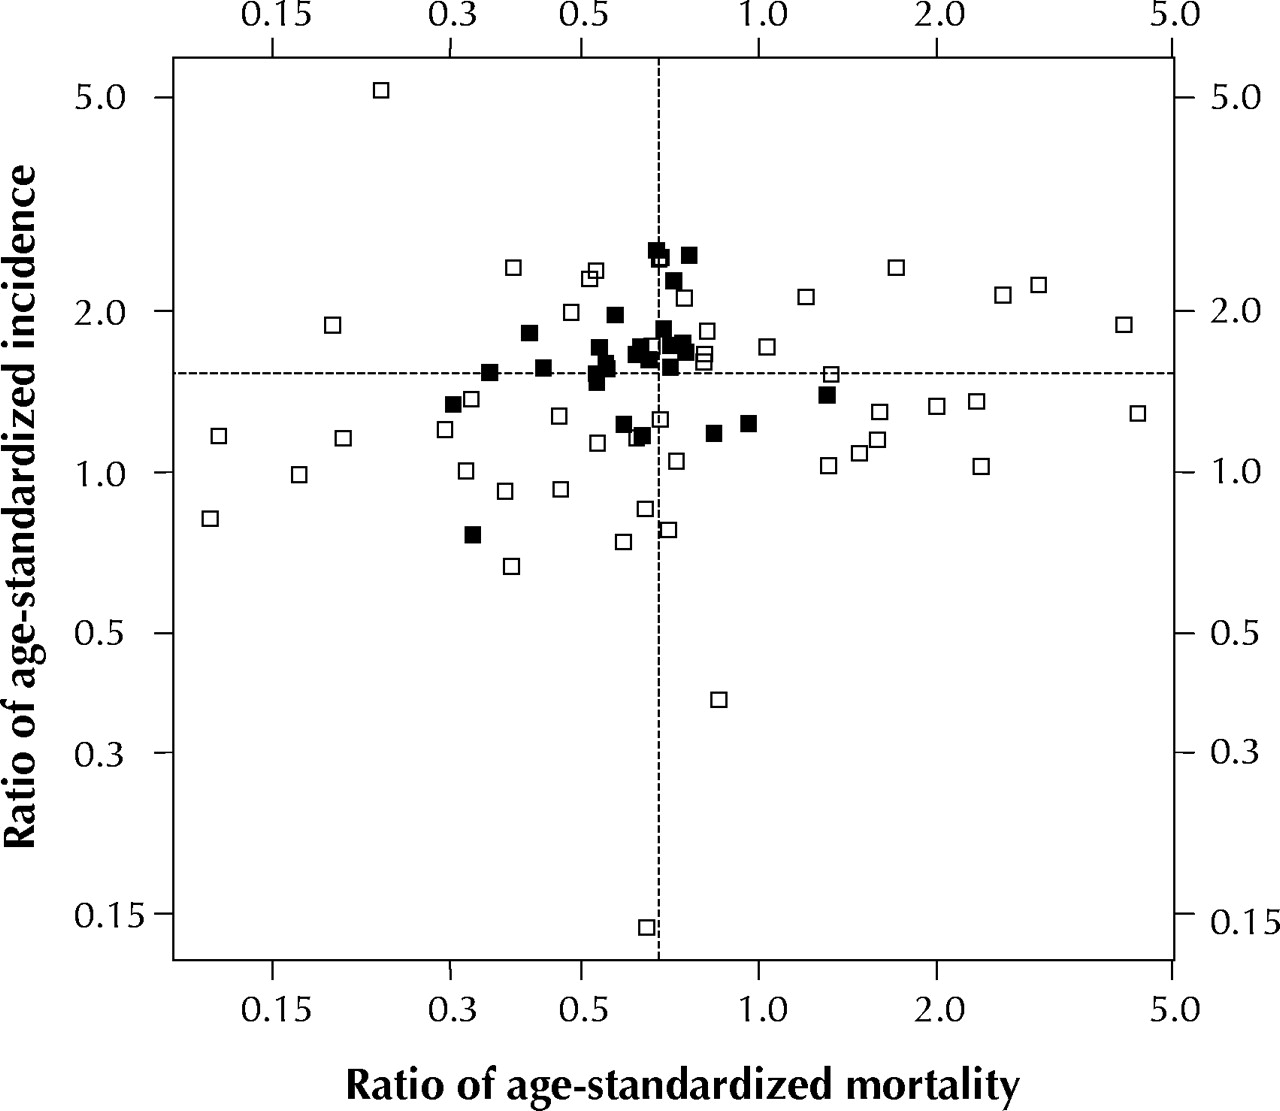
Fig. 2: Ratio of age-standardized incidence (rate in 1990–1994 divided by rate in 1985–1989) plotted against the ratio of age-standardized mortality (rate in 1995–1999 divided by rate in 1985–1989) among men aged 50–74 years in the small health regions (SHAs) in British Columbia. (Values are shown for the 75 SHAs whose values could be plotted on the logarithmic scales.) SHAs with 10 or more deaths from prostate cancer in 1985–1989 are represented by black sqaures; all other SHAs are represented by white squares. The dotted lines indicate provincial averages.


Tables
Table 1.

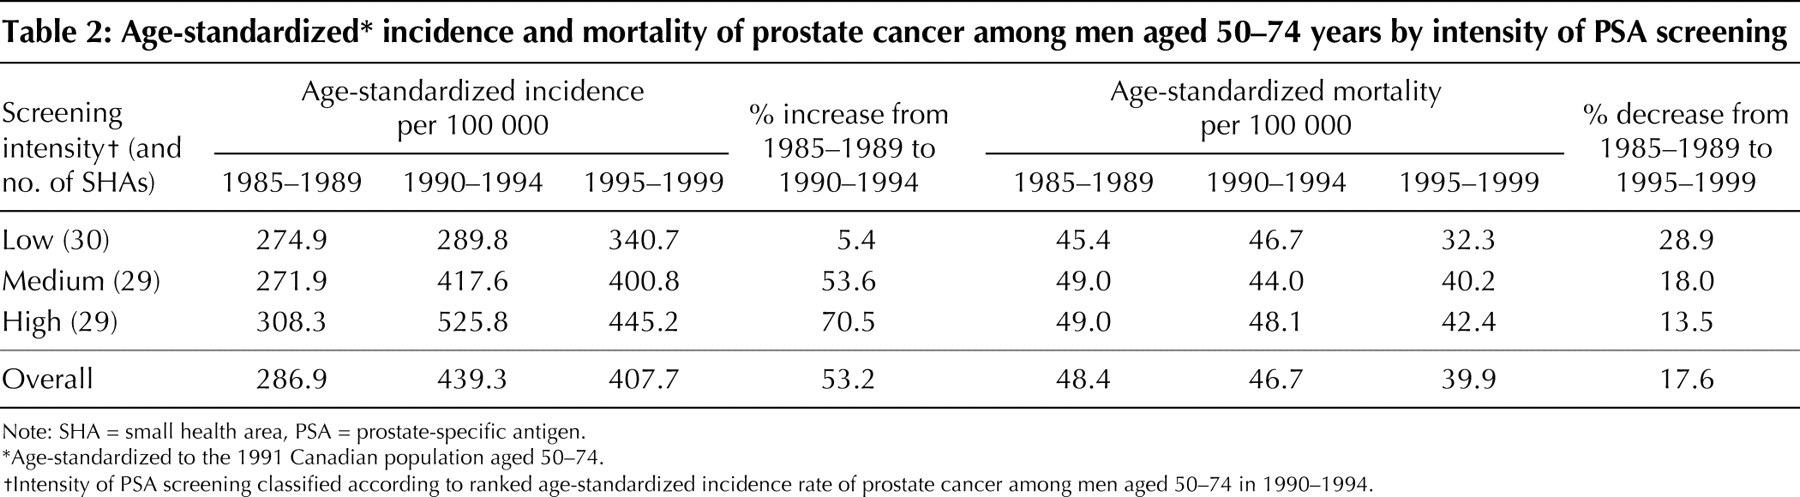
Table 2.

In this issue
Article tools


Jump to section
Related Articles
Cited By...
More in this TOC Section
Similar Articles
Collections

