


Article Figures & Tables
Figures
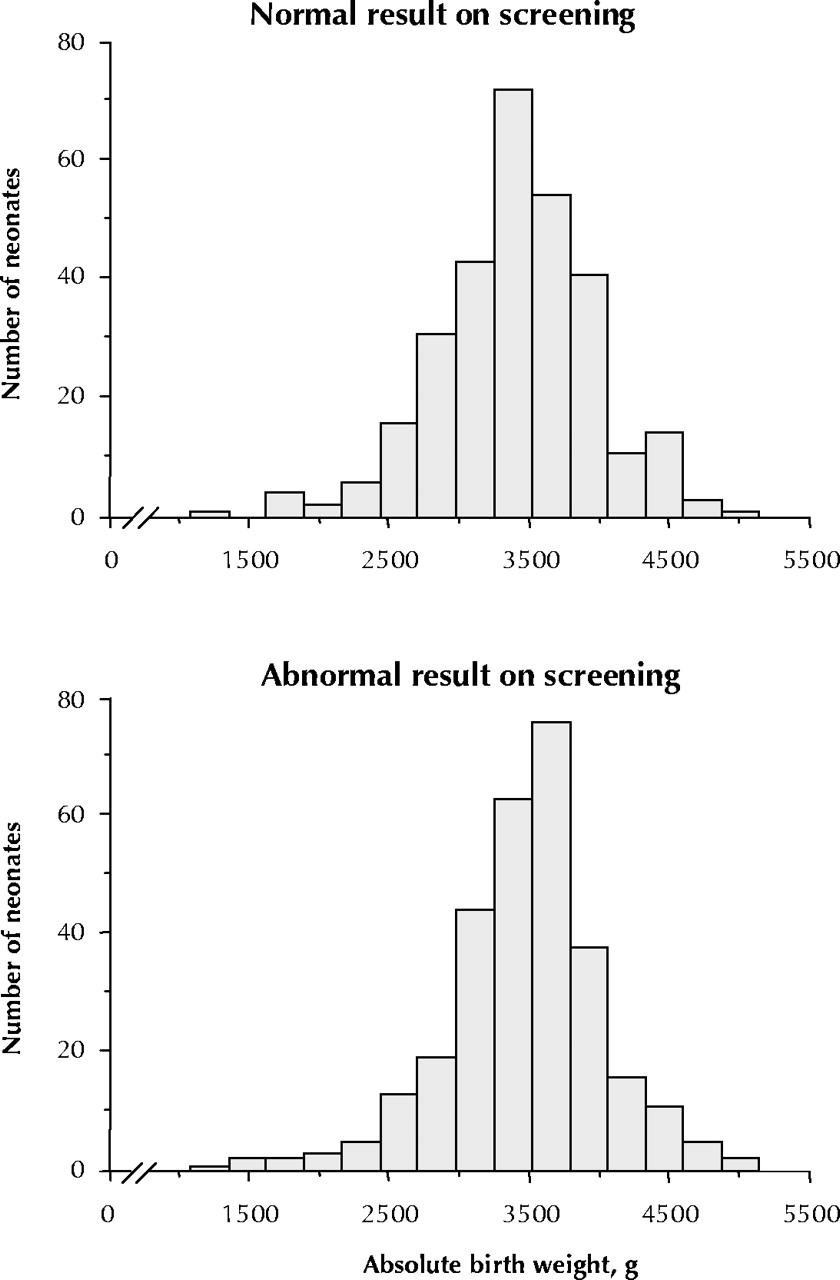
Fig. 1: Distributions of absolute weights of babies from 600 singleton pregnancies according to the results of screening with a 50-g oral glucose load (O'Sullivan screening test) administered to the mothers at 24 to 28 weeks, gestational age. Top: Babies whose mothers had a normal result on the O'Sullivan test (plasma glucose level 1 hour after 50-g glucose load less than 8.0 mmol/L; n = 300). Bottom: Babies whose mothers had an abnormal result on the O'Sullivan test (plasma glucose level 1 hour after 50-g glucose load 8.0 mmol/L or greater; n = 300). Neonates born to 6 women who were treated with insulin during their pregnancies are included in the bottom panel of this figure.
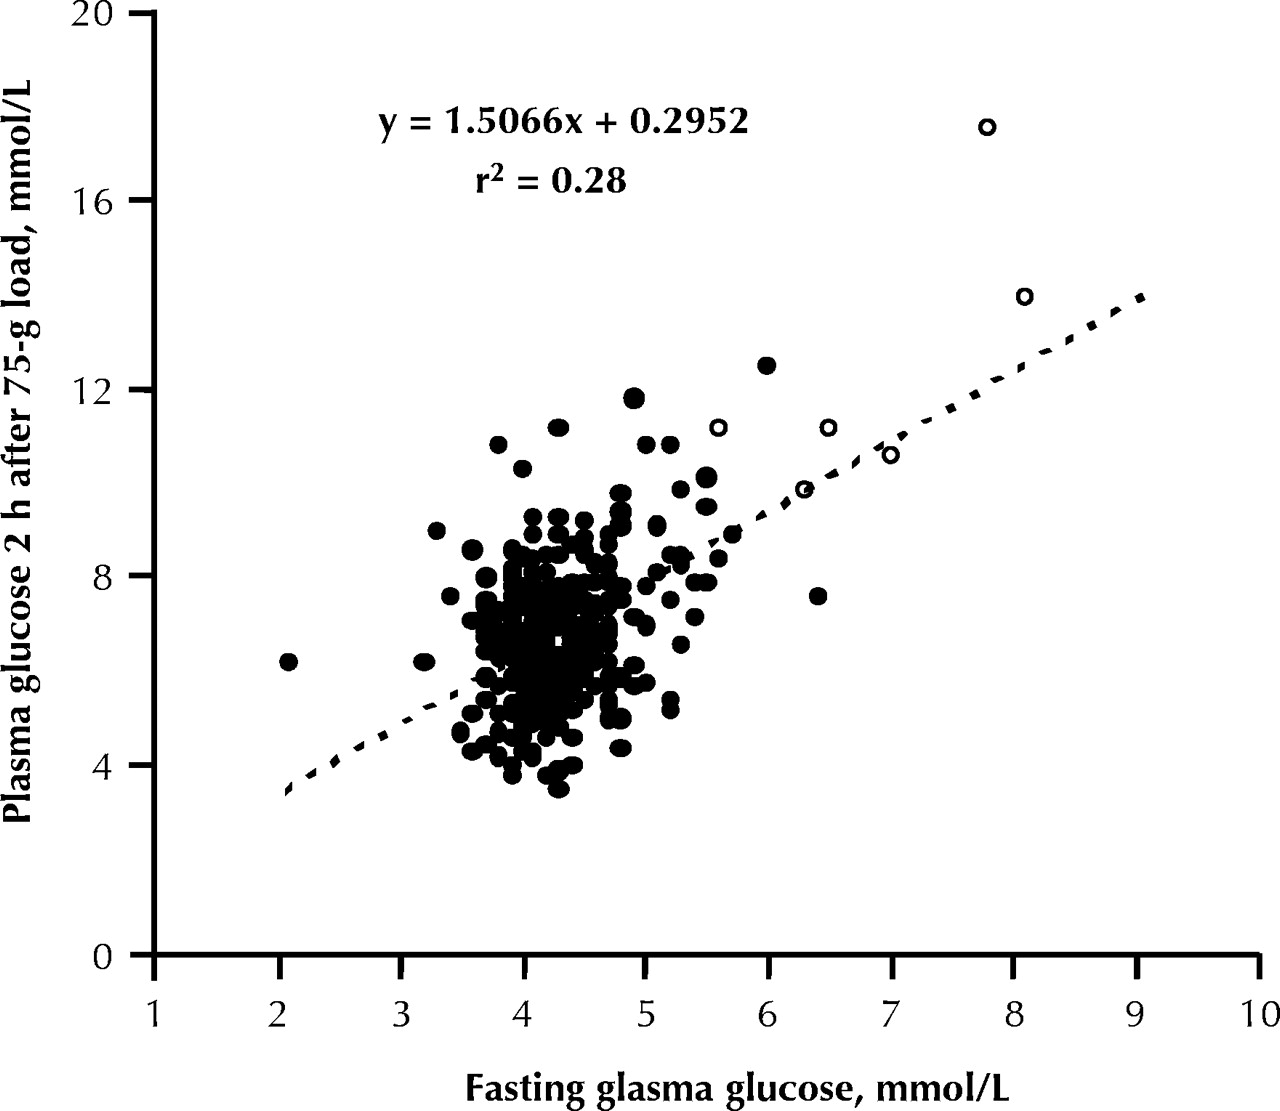
Fig. 2: Simple correlation between fasting plasma glucose level (X axis) and plasma glucose level 2 hours after a 75-g oral glucose tolerance test (OGTT) (Y axis) in 300 pregnant women who had abnormal results on initial screening with a 50-g oral glucose load. The 6 open symbols represent the women who were put on insulin after the OGTT. When the 2 women with fasting plasma glucose concentrations around 8 mmol/L were excluded, the r2 coefficient was reduced to 0.17.
Fig. 3: Box-and-whisker plots of birth weight percentiles according to maternal plasma glucose levels after a 50- or 75-g oral glucose load. The top of each box represents the third quartile (75th percentile) and the bottom the first quartile (25th percentile) of the birth weight percentile. The median of each distribution is indicated by the horizontal line within the box. Weight percentile values below the 10th or above the 90th percentile are shown individually. The numbers of pregnant women for each plasma glucose variable were as follows: 1 hour after 50-g oral glucose load (O'Sullivan test), 594; fasting plasma glucose, 294; and 2 hours after 75-g oral glucose load, 294.
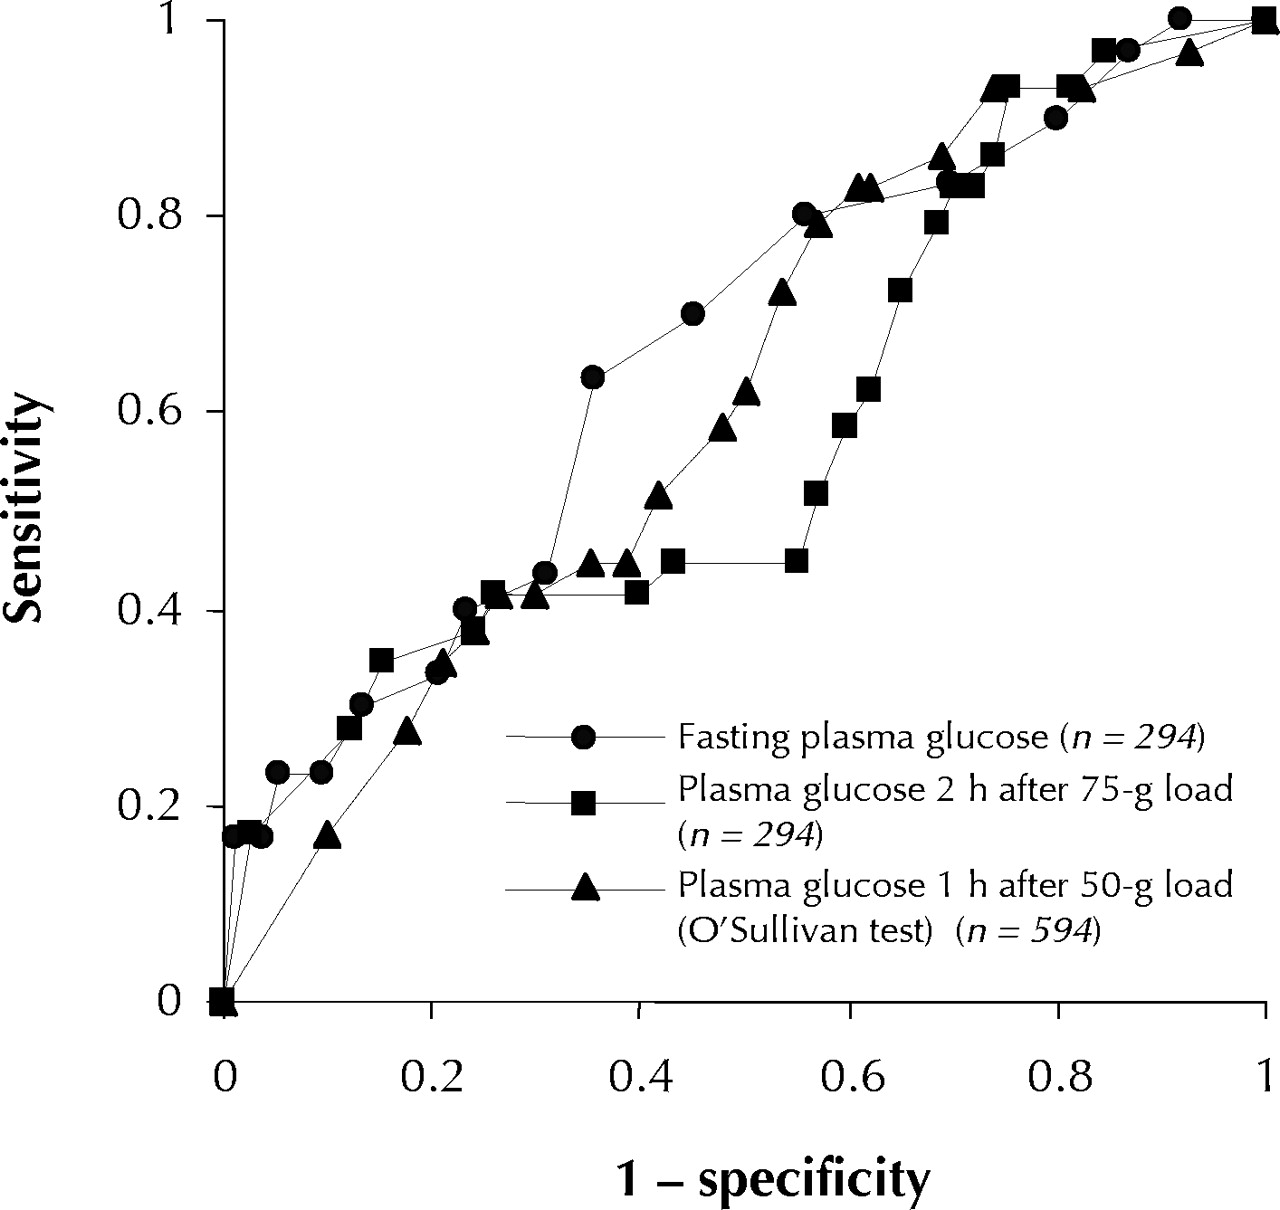
Fig. 4: Receiver operating characteristic (ROC) curves for large-for-gestational-age neonates (90th percentile or larger) against 3 plasma glucose variables: fasting plasma glucose, plasma glucose 2 hours after a 75-g glucose load and plasma glucose 1 hour after a 50-g glucose load (the O'Sullivan screening test). The areas under the ROC curves were 0.67, 0.61 and 0.52 respectively, which indicates the relatively poor diagnostic performance of these tests, and there were no statistically significant differences among them ( p > 0.05). The dotted diagonal line illustrates a theoretical test in which there would be no diagnostic discrimination.

Tables
Table 1.

Table 2.
Table 3.


In this issue
Article tools


Jump to section
Related Articles
Cited By...
More in this TOC Section
Similar Articles

