


Article Figures & Tables
Figures
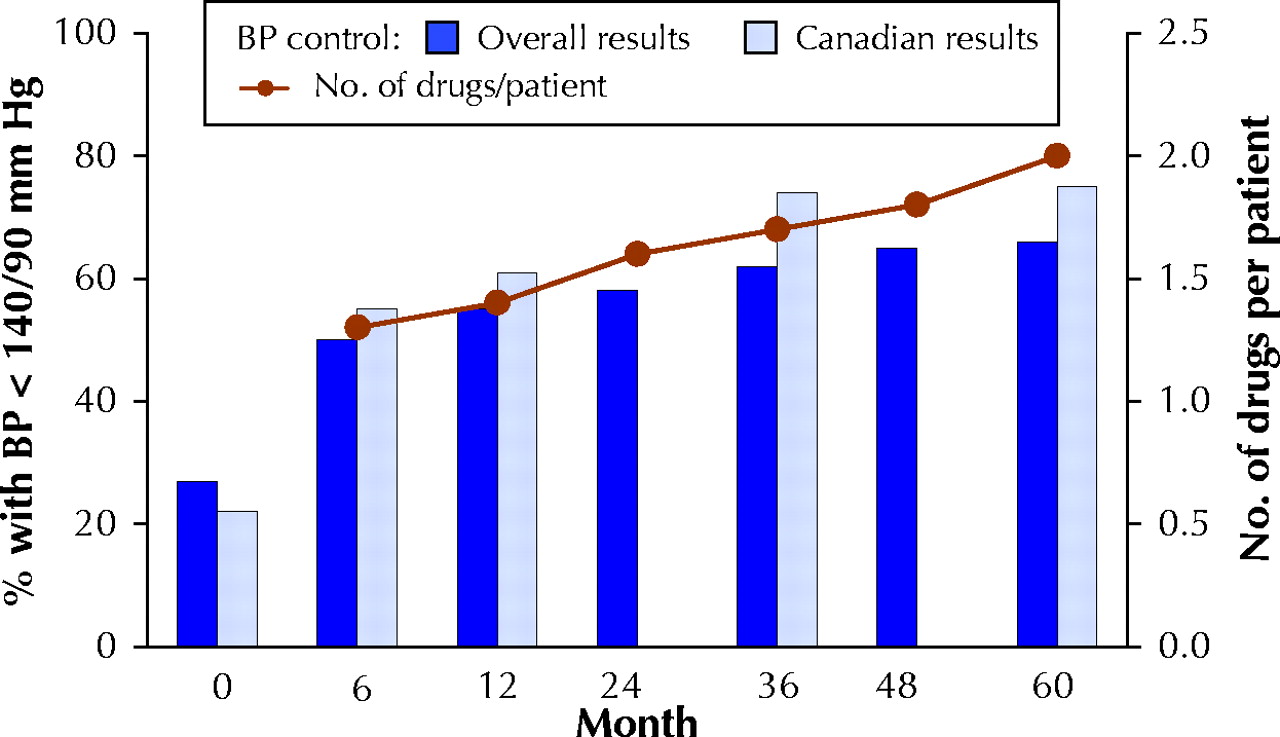
Fig. 1: Blood pressure (BP) control rates during the ALLHAT study. Bars represent proportion of participants who achieved target BP (< 140/90 mm Hg) among those attending follow-up visits. Line represents mean number of antihypertensive drugs prescribed per patient.
In this issue

Article tools
Respond to this article


Jump to section
Related Articles
Cited By...
More in this TOC Section
Similar Articles

