


Article Figures & Tables
Figures
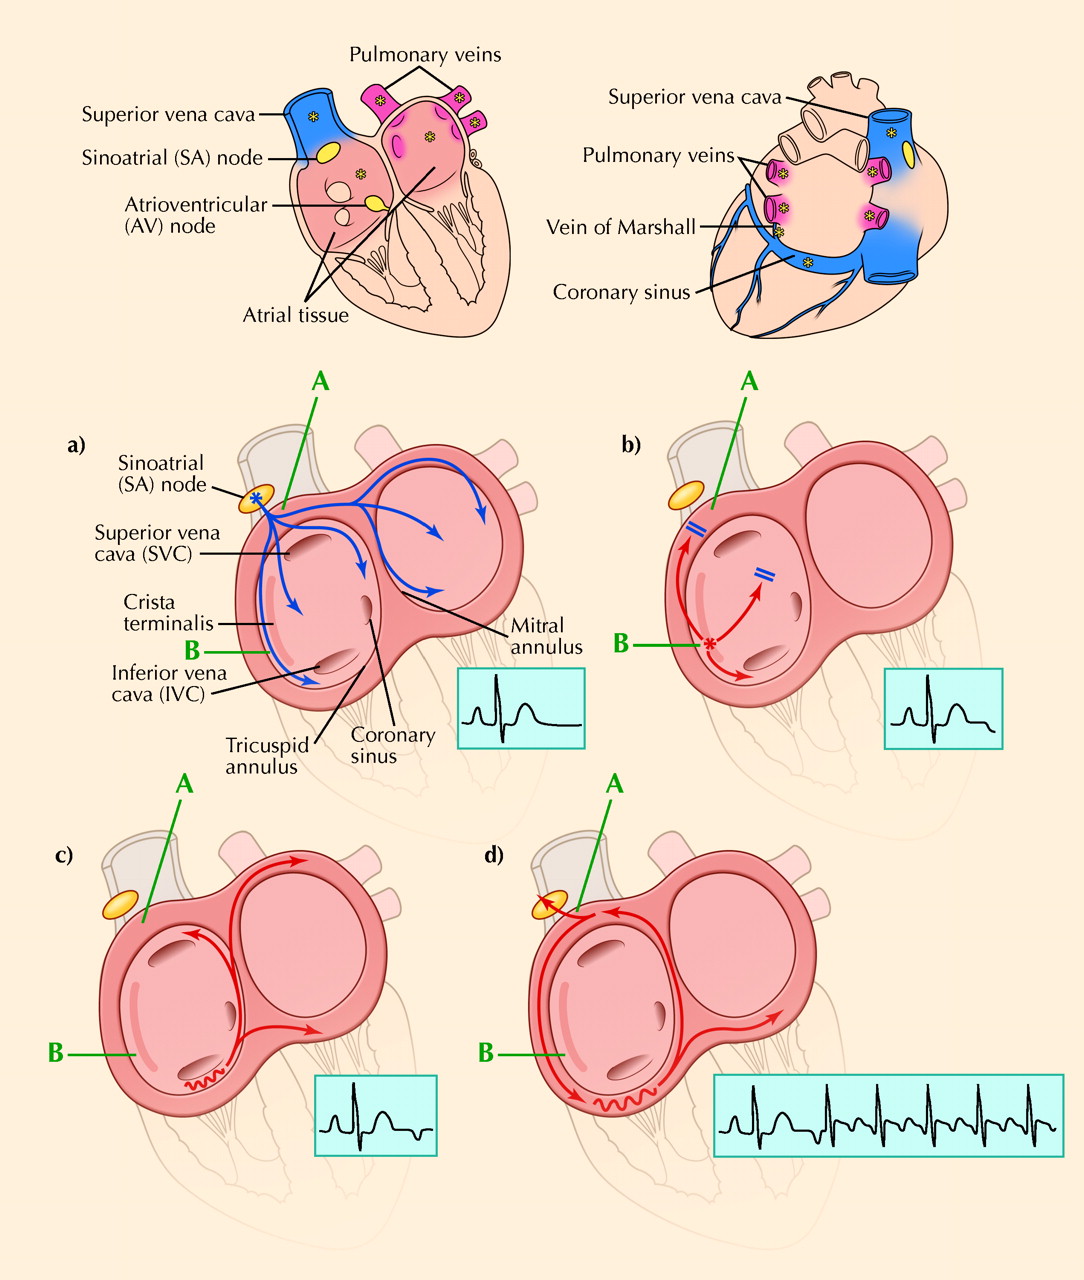
Fig. 1: Re-entry. a) A sinus impulse activates area A. b) A premature beat arising in area B fails to reach area A because the intervening tissue remains refractory from the preceding sinus beat. c) The premature stimulus travels slowly via an alternative route back to area A, allowing enough time for area A to recover and be excited. d) Area A re-excites area B, and the cycle sustains itself. This particular example illustrates the mechanism of typical atrial flutter. Photo: Christine Kenney
Fig. 2: Anatomic versus functional re-entry. In anatomical re-entry, circuit size is determined by fixed anatomic obstacles (left). In functional re-entry (middle), circuit size = conduction velocity х refractory period (length of the refractory tail). If the wavefront travels too quickly, or its refractory period is too long, its leading end would “bite its tail” and extinguish itself (right). Thus, these properties determine the smallest possible circuit size. Photo: Christine Kenney
Fig. 3: Action potential duration: normal versus after atrial fibrillation. The action potential duration and refractory period are shortened as the calcium current is reduced. Photo: Christine Kenney
Fig. 4: A fibrillating isolated pulmonary vein. The top tracing is a single-surface-lead electrocardiogram tracing (at a faster-than-usual paper speed). The tracings underneath are recorded from inside the pulmonary vein of a patient who is undergoing a catheter-based procedure for paroxysmal atrial fibrillation. Note that the vein is fibrillating, but the heart is in normal sinus rhythm. The fibrillating pulmonary venous musculature has been “isolated” from the rest of the heart. [Reproduced, with permission, from reference 42.]


In this issue

Article tools


Jump to section
Related Articles
Cited By...
- No citing articles found.
Similar Articles
Collections

