


Article Figures & Tables
Figures
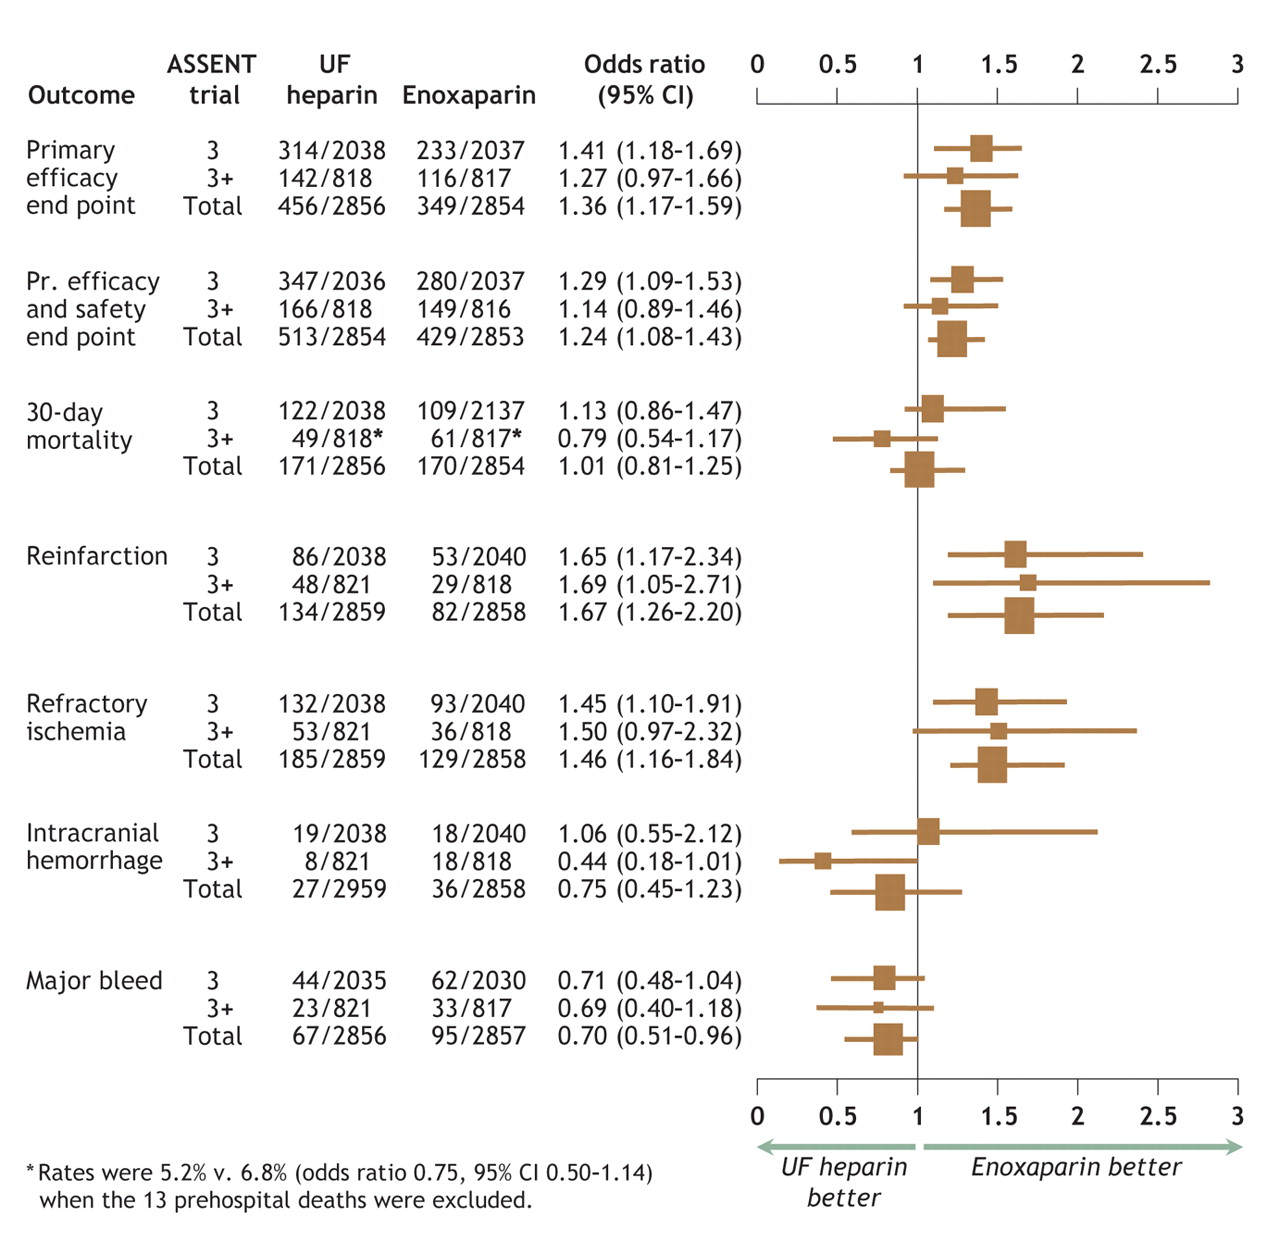
Fig. 1: Odds ratios and 95% confidence intervals (CI) for individual and composite efficacy and safety end points for ASSENT-3 (indicated as 3), ASSENT-3 PLUS (3+) and pooled (Total) data. Data are plotted as odds ratios (the dimensions of the boxes represent relative population sizes) with 95% confidence intervals (bars). ASSENT = Assessment of the Safety and Efficacy of a New Thrombolytic Agent, UF = unfractionated, Pr. = primary.
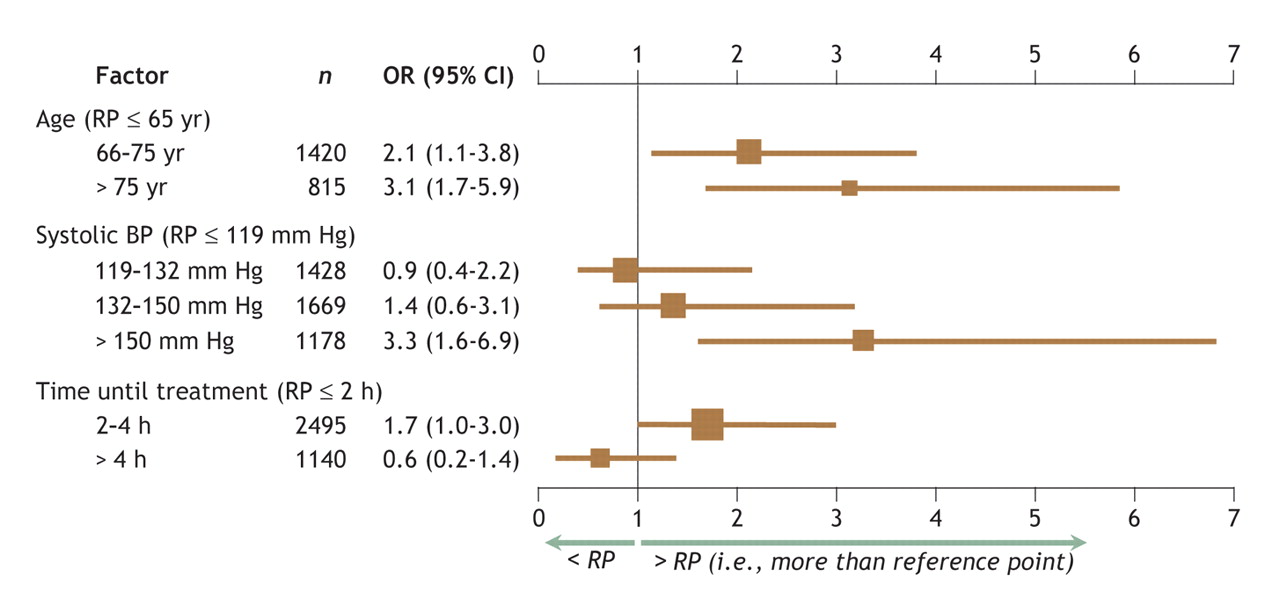
Fig. 2: The main effects, in terms of odds ratios (ORs, shown in the graph as boxes) and 95% confidence intervals (CI, shown as bars), of independent factors predicting the occurrence of intracranial hemorrhage relative to the reference points of age ≤ 65 years, systolic blood pressure ≤ 119 mm Hg and time from symptom onset to treatment ≤ 2 hours (N = 5717). The relative importance of these 3 measures, as indicated by their χ2 values, is 15, 17 and 10, respectively. There was a 4-way age–sex–treatment–trial interaction (p = 0.005). The area under the receiver–operator curve (AUC index) for this logistic regression was 0.728.
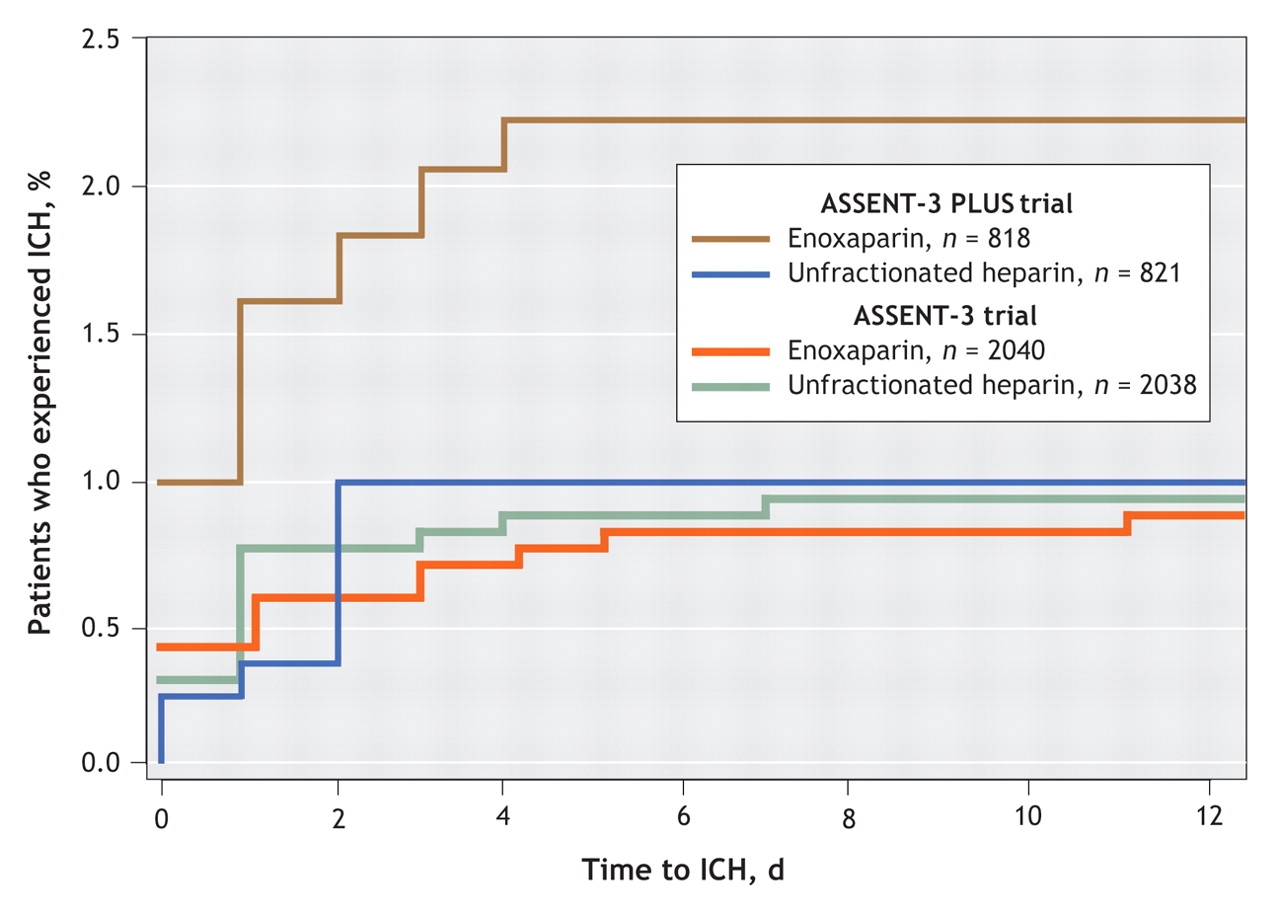
Fig. 3: Cumulative occurrence of intracranial hemorrhage (ICH) by antithrombotic treatment group. Data from the enoxaparin group from the ASSENT-3 PLUS trial were compared with those from the ASSENT-3 trial (p = 0.01), and with data from the unfractionated heparin groups of the ASSENT-3 PLUS (p = 0.047) and ASSENT-3 (p = 0.004) trials, by means of the log–rank test.
Tables
Table 1.

Table 2.
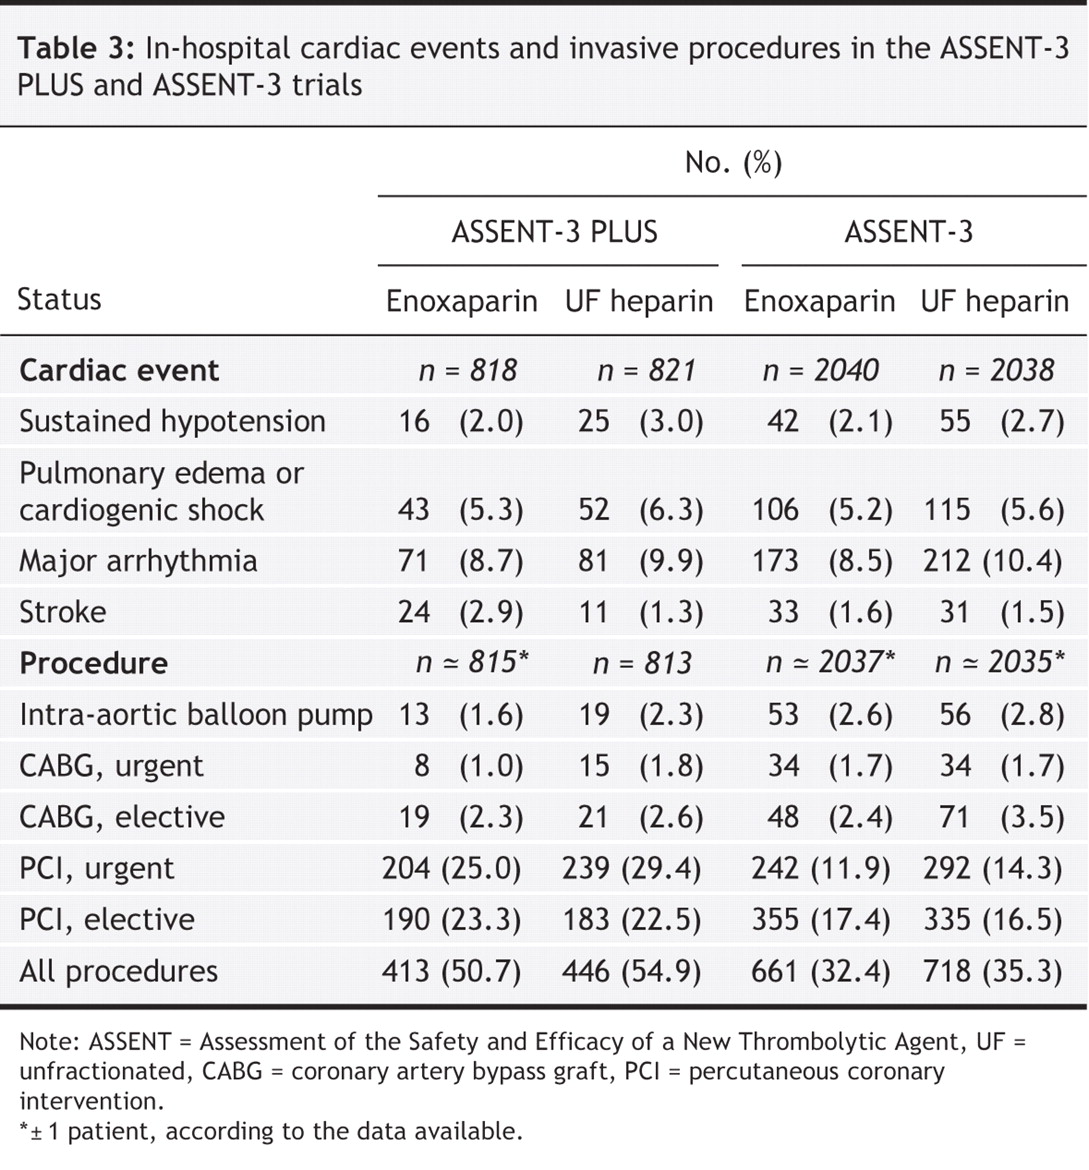
Table 3.


In this issue

Article tools


Jump to section
Related Articles
Cited By...
- Antithrombotic Therapy in the Elderly
- Part 10: Acute Coronary Syndromes: 2010 American Heart Association Guidelines for Cardiopulmonary Resuscitation and Emergency Cardiovascular Care
- Part 9: Acute Coronary Syndromes: 2010 International Consensus on Cardiopulmonary Resuscitation and Emergency Cardiovascular Care Science With Treatment Recommendations
- Low-molecular-weight heparins as adjunctive therapy to thrombolytics: extracting the best data.
More in this TOC Section
Similar Articles
Collections

