


Article Figures & Tables
Figures
Fig. 1: Pertussis incidence rate, Canada, 1924–2002. The incidence dropped after a vaccine was introduced in 1943 and reached an all-time low of 4.3 per 100 000 in 1988. Since then, the incidence has increased again, remaining between 9.5 and 35 per 100 000 per year between 1991 and 2002, with an average of 5720 cases reported each year.
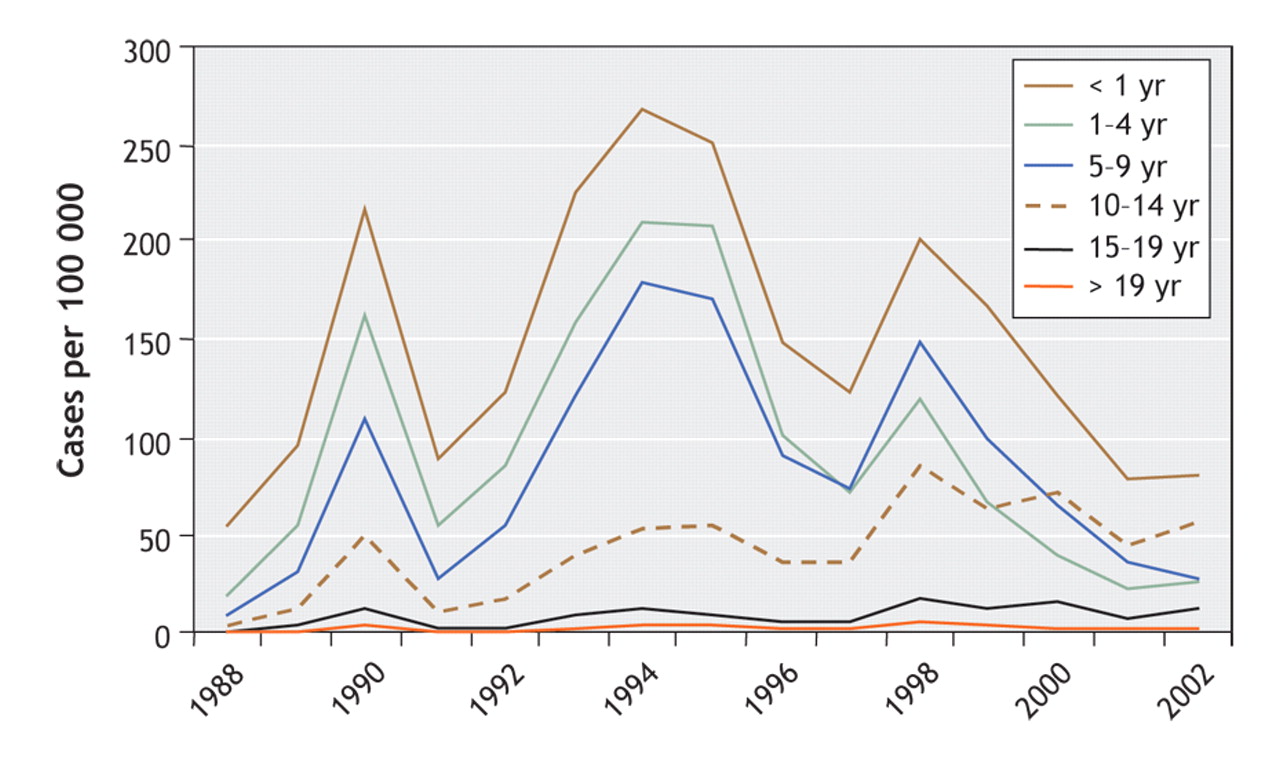
Fig. 2: Age-specific pertussis incidence rates, Canada, 1988–2002. The highest incidence has remained among infants. The incidence has been dropping among children younger than 10 years of age since 1998, but in the 1990s it increased among those 10 years and older. Since 2000, children 10–14 years of age have had the second highest incidence after that observed among infants. The proportion of cases among adults (> 19 years) increased from 6% of all cases in 1988 to 18% of all cases in 2002.
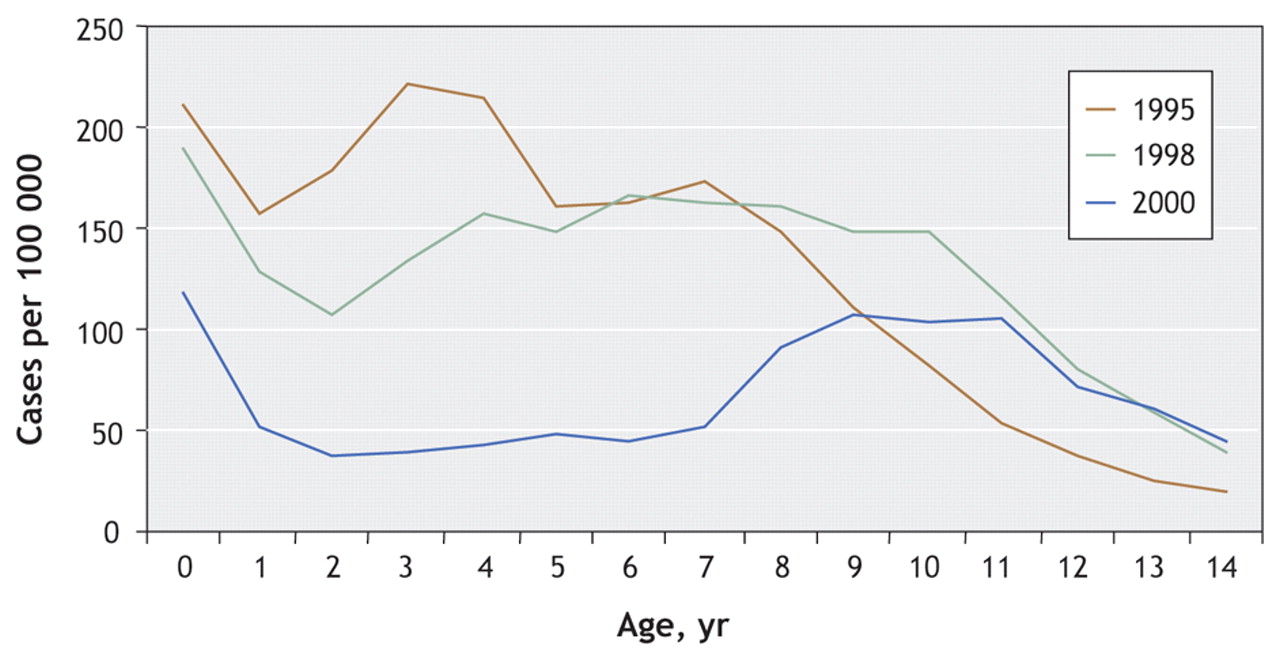
Fig. 3: Pertussis incidence by age among children in 4 provinces in 1995, 1998 and 2000. During the 1990s, excluding infants, the highest incidence was observed among children born between the late 1980s to early 1990s: in 1995, the highest incidence was observed among children 3 years of age, in 1998 among those 6 years of age and in 2000 among those 9 years of age.


In this issue
Article tools


Jump to section
Related Articles
Cited By...
More in this TOC Section
Similar Articles
Collections

