


Article Figures & Tables
Figures
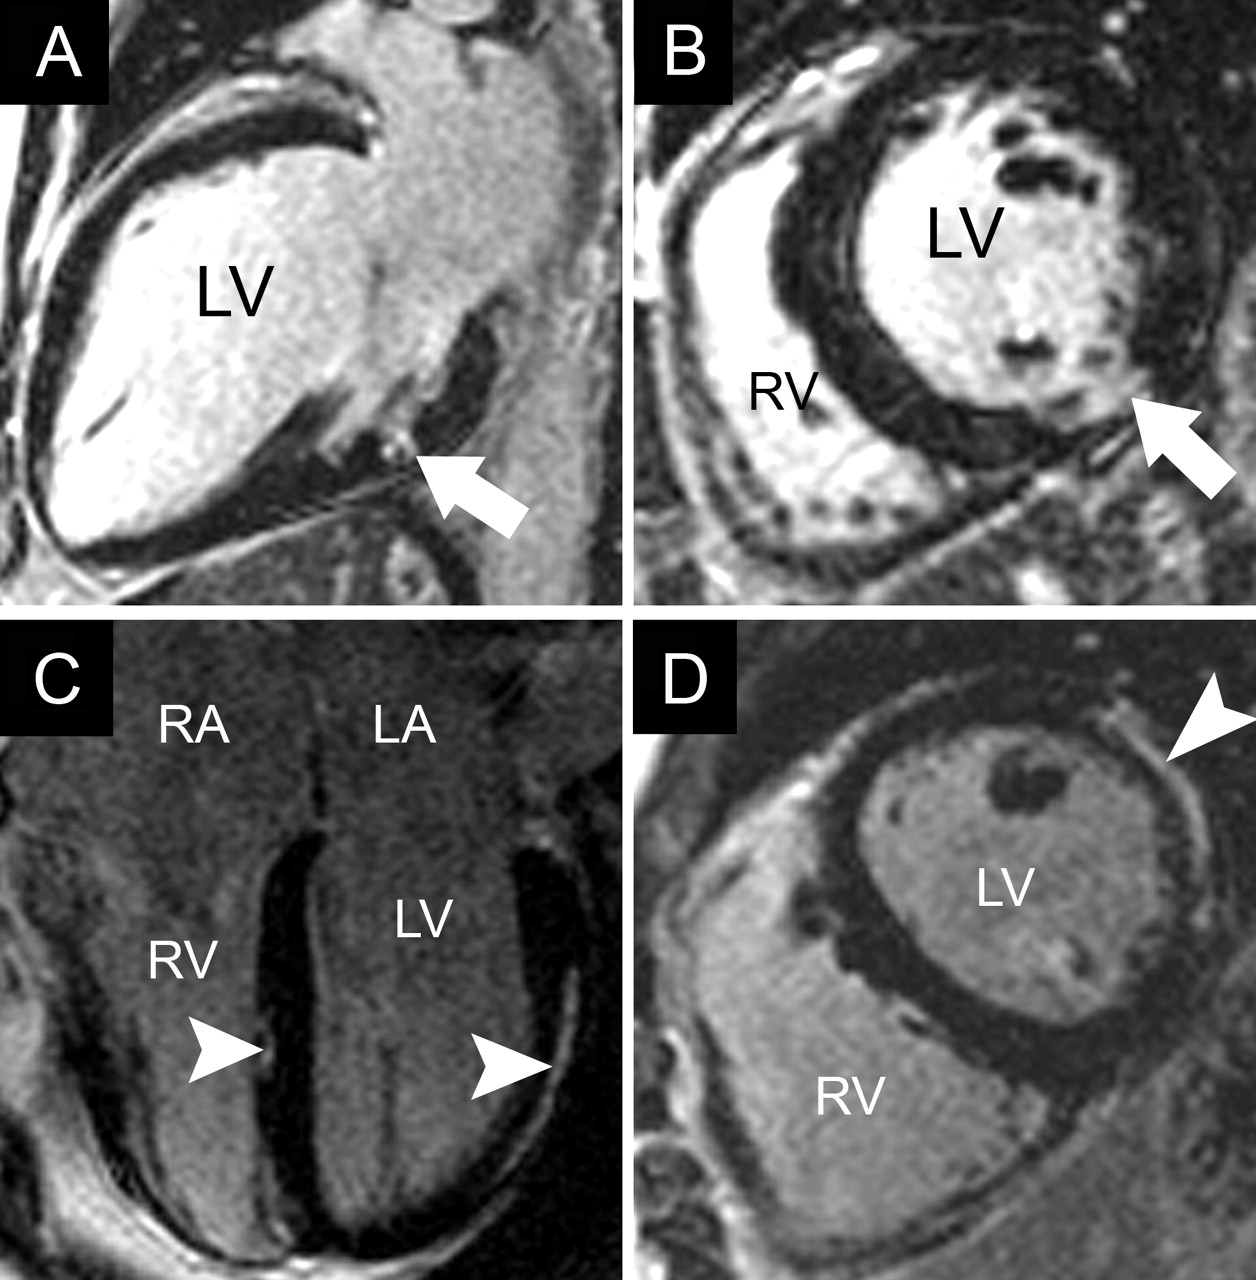
Fig. 1: Results of cardiovascular MRI with delayed contrast enhancement in myocardial infarction (MI). A and B: Four-chamber and 2-chamber views, respectively, of acute (48-hour) transmural anterior MI with areas of microvascular obstruction (black arrowhead) surrounded by bright signal (white arrowhead), the “halo sign,” and apical thrombus (black arrow). C and D: Two-chamber and short-axis views, respectively, of old MI limited to the subendocardial region of the basal inferolateral wall (arrows). LA = left atrium, LV = left ventricle, RV = right ventricle.
Fig. 2: Results of cardiovascular MRI with delayed contrast enhancement in sarcoidosis and myocarditis. A and B: Two-chamber and short-axis views, respectively, of cardiac involvement in a patient with known pulmonary sarcoidosis, showing a small midwall area of myocardial hyperenhancement in the inferolateral region (arrow). C and D: Modified 4-chamber and short-axis views, respectively, of myocarditis with a subepicardial pattern of hyperenhancement in the lateral wall and a small region in the interventricular septum (arrowheads). RA = right atrium.
Fig. 3: Results of cardiovascular MRI in constrictive pericarditis and atrial septal defect. A and B: Four-chamber and short-axis T1-weighted (“dark-blood”) breath-holding views, respectively, of constrictive pericarditis after coronary bypass surgery, showing thickened pericardium (7 mm) (arrowheads), enlargement of both atria and a tubular right ventricle (RV). Asterisk indicates sternal wire artifacts. C and D: Four-chamber still frame from cine-MRI (“bright-blood”) and 4-chamber velocity mapping image (in plane flow), respectively, of large atrial septal defect (2 × 2.5 cm) (black arrow) with left-to-right shunt visible on the velocity-encoded image (white arrow) and enlarged right-sided chambers with a calculated ratio of pulmonary to systemic flow of 3.7.


Article tools


Jump to section
Related Articles
Cited By...
More in this TOC Section
Similar Articles
Collections

