


Article Figures & Tables
Figures
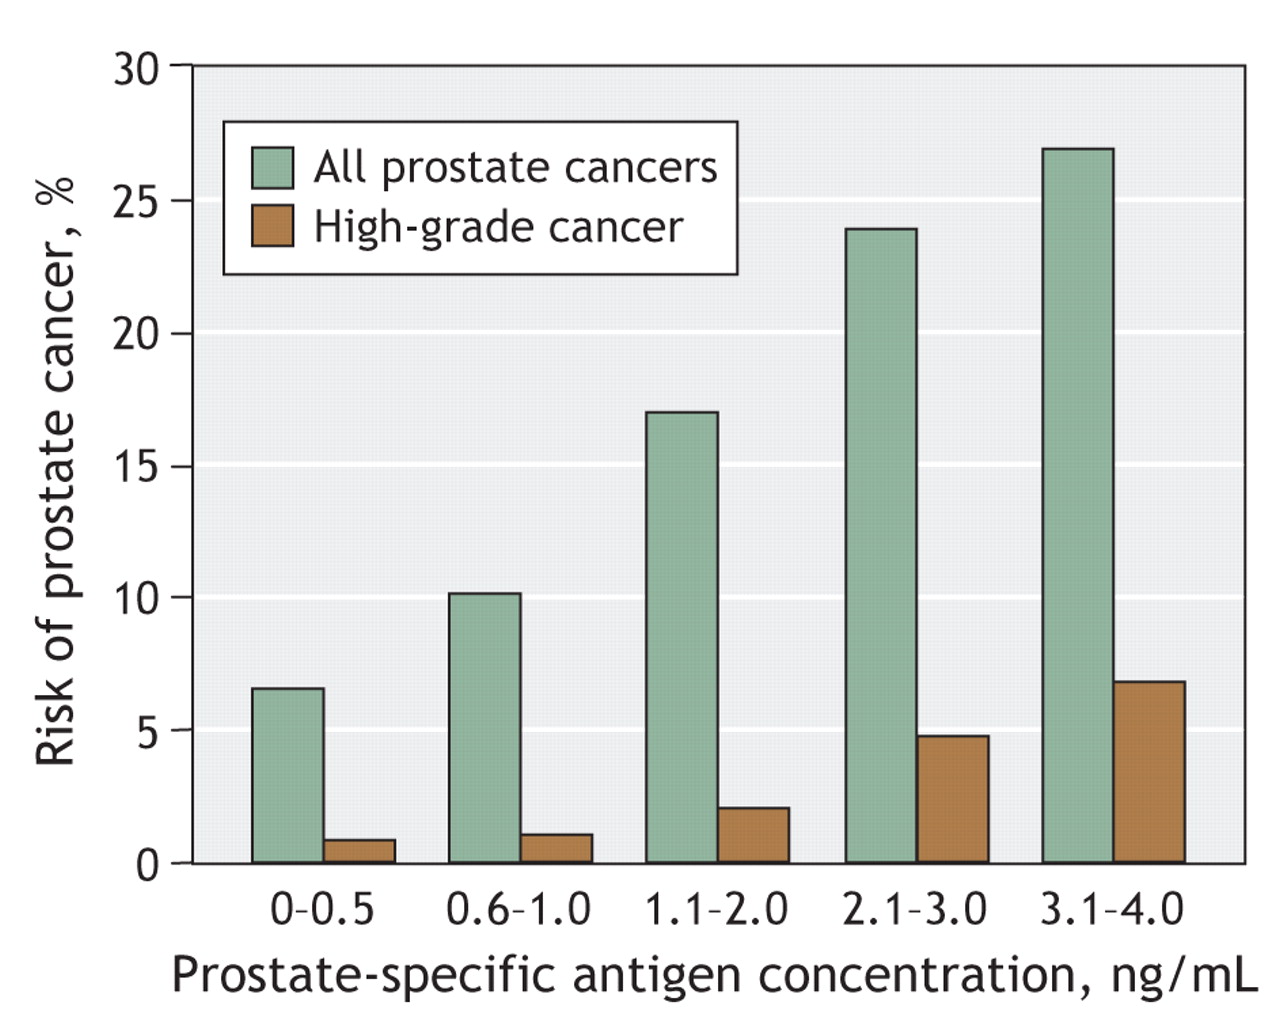
Fig. 1: Risk of prostate cancer by range of prostate-specific antigen level. Data are from control subjects involved in the Prostate Cancer Prevention Trial (N Engl J Med 2004;350:2239-46)20 who had normal digital rectal examination results and prostate-specific antigen levels < 4.0 ng/mL throughout the 7-year study, as well as an end-of-study biopsy (n = 2950). High-grade cancer refers to a Gleason score ≥ 7.
Fig. 2: Micrographs of thin slices of prostate cancer tissue. Left, a mixture of two grade 3 patterns: Gleason grade 3+3 (a score of 6). Right, the most aggressive histologic pattern: Gleason score 10. Photo by: Dean A. Troyer, MD, Department of Pathology, University of Texas Health Science Center at San Antonio, Tex.
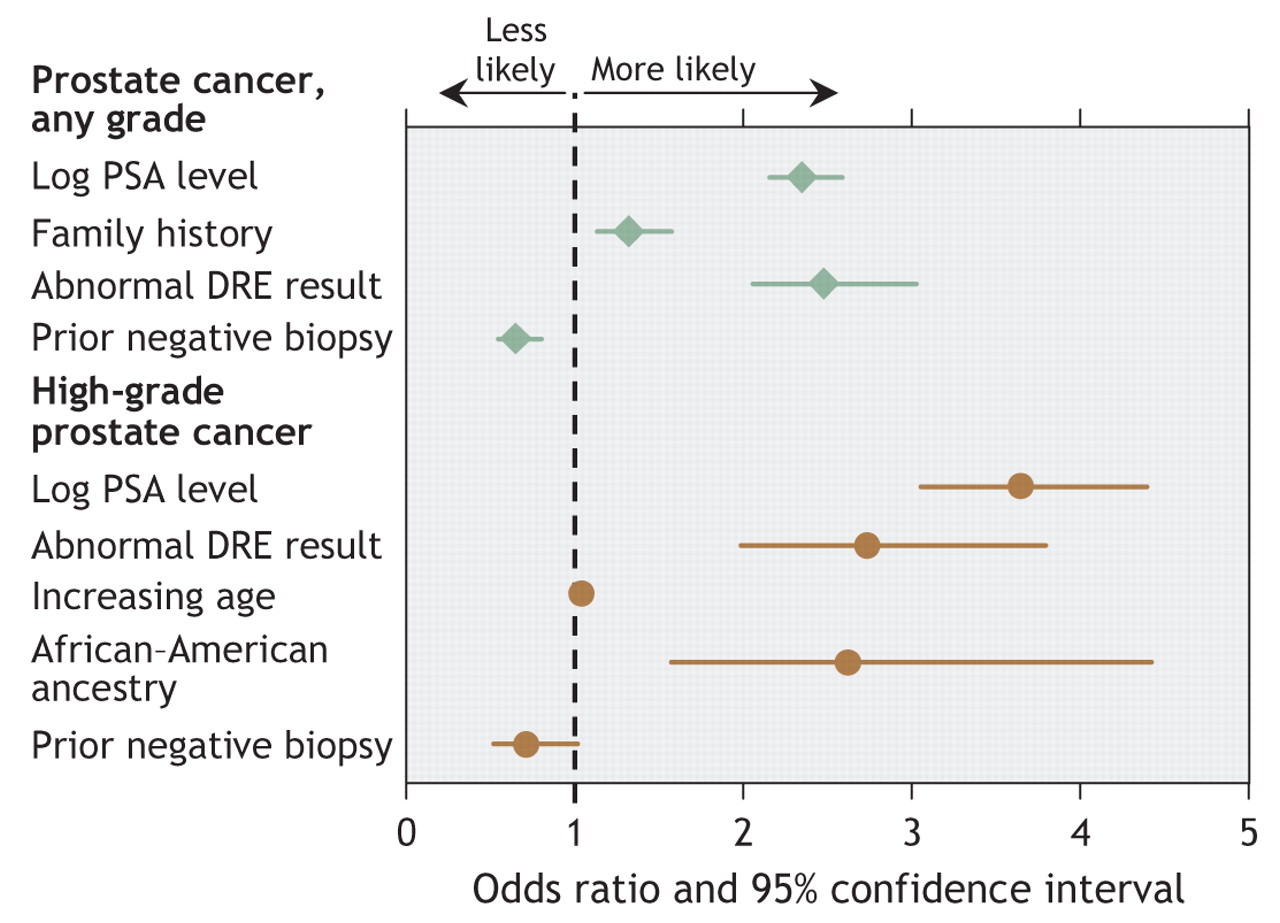
Fig. 3: Forest plot of risk factors for prostate cancer and for high-grade prostate cancer (Gleason score ≥ 7) if a prostate biopsy is performed. PSA = prostate-specific antigen, DRE = digital rectal examination.


Tables
Table 1.

Table 2.


In this issue

Article tools


Jump to section
Related Articles
Cited By...
- Uptake of prostate cancer screening and associated factors among Chinese men aged 50 or more: a population-based survey
- A Prospective, Multicenter, National Cancer Institute Early Detection Research Network Study of [-2]proPSA: Improving Prostate Cancer Detection and Correlating with Cancer Aggressiveness
- Activation of the Osteopontin/Matrix Metalloproteinase-9 Pathway Correlates with Prostate Cancer Progression
- A Feedback Loop between the Androgen Receptor and a NEDD4-binding Protein, PMEPA1, in Prostate Cancer Cells
More in this TOC Section
Similar Articles
Collections

