


Article Figures & Tables
Figures
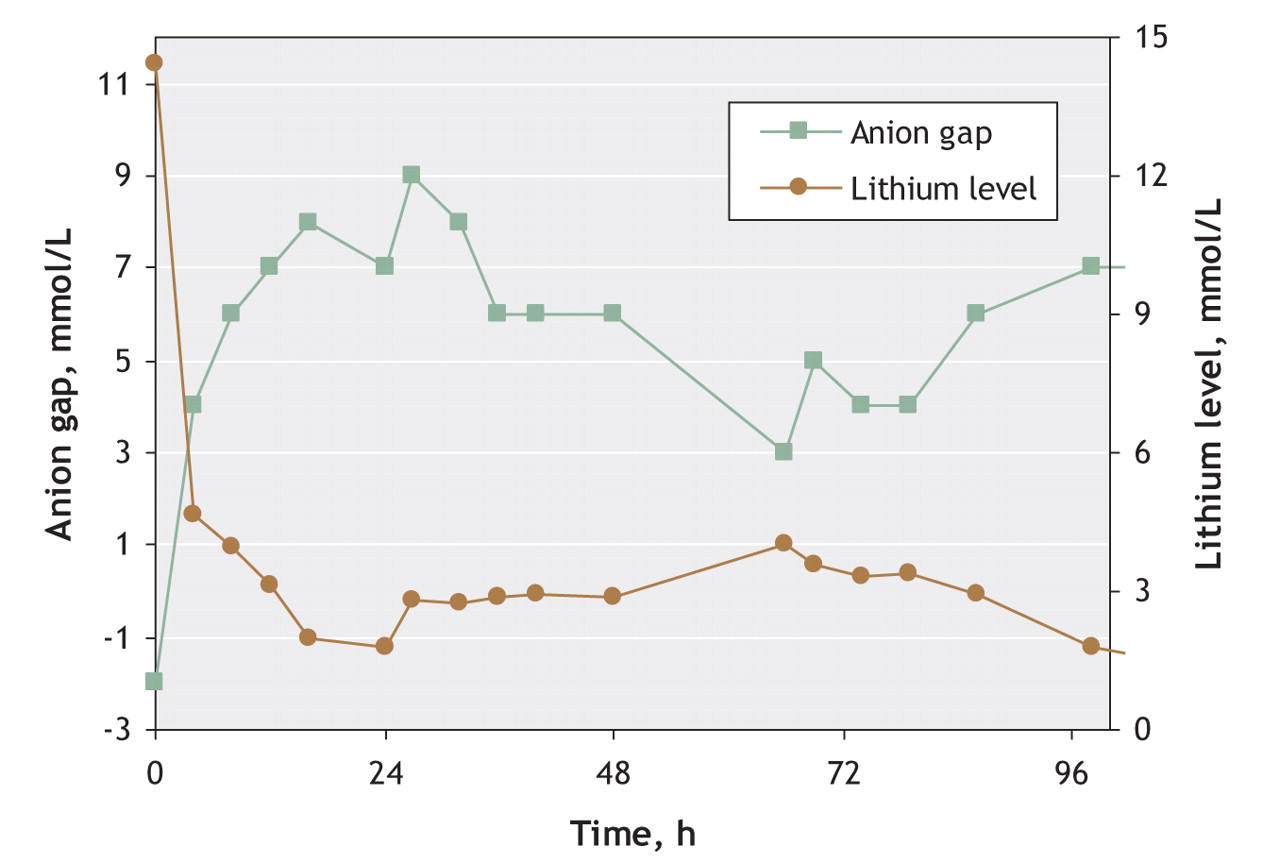
Fig. 1: Inverse correlation between lithium level and anion gap over time. Of note, the initial anion gap of –2 mmol/L corresponded to a lithium level of 14.5 mmol/L.
Fig. 2: Effects of intermittent hemodialysis and continuous venovenous hemodiafiltration on lithium levels. Time zero was arrival at our centre. Arrow indicates rebound in lithium levels that required initiation of continous venovenous hemodiafiltration.


Tables
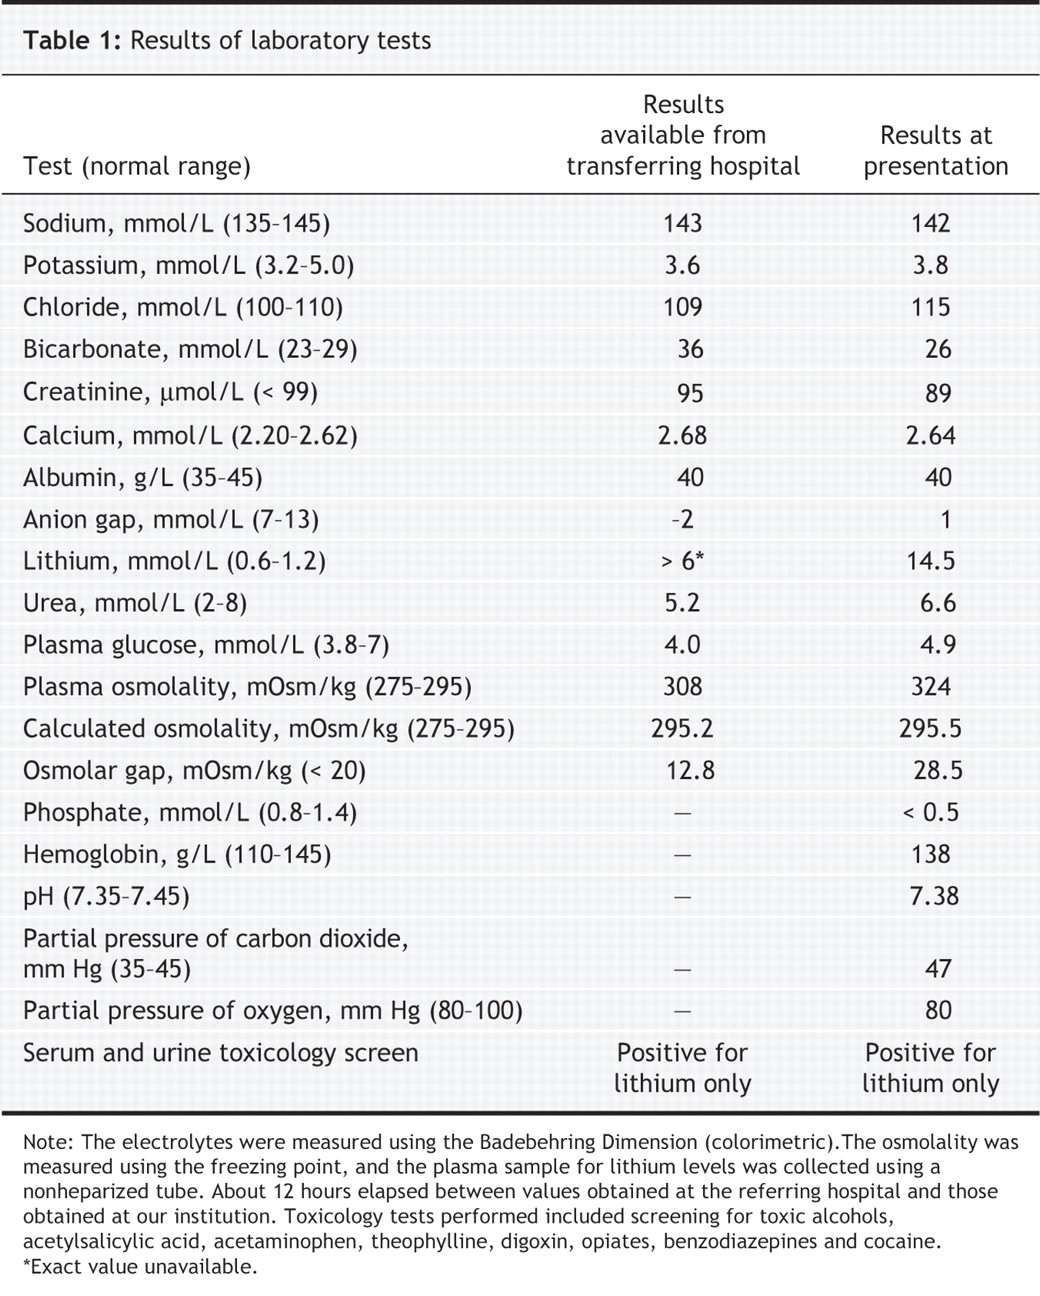
Table 1.

In this issue
Article tools
Respond to this article


Jump to section
Related Articles
Cited By...
More in this TOC Section
Similar Articles
Collections

