


Article Figures & Tables
Figures
Figure 1: Two designs of randomized controlled trials used to investigate long-term antidepressant therapy.
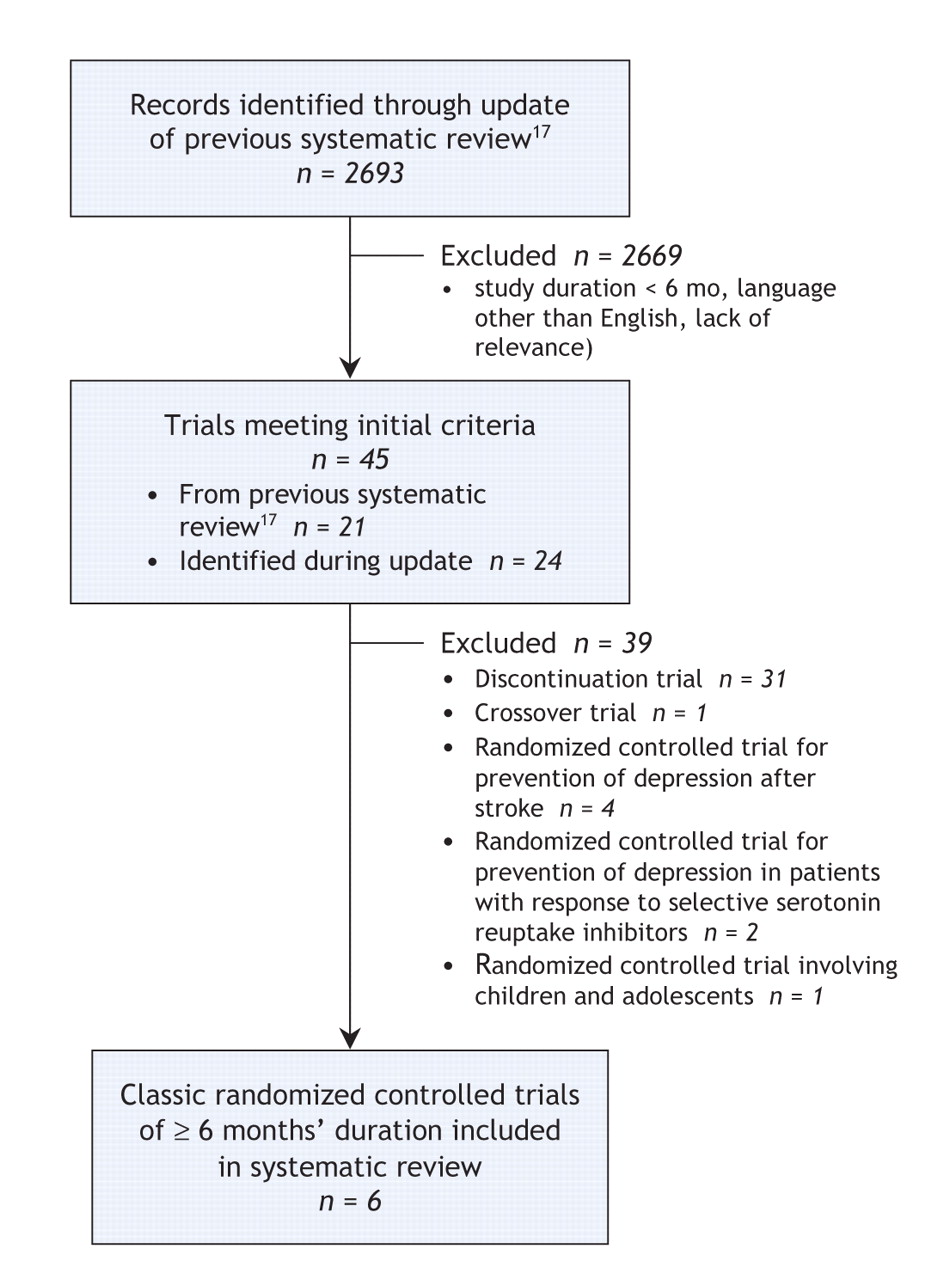
Figure 2: Flow diagram for identification of classic placebo-controlled randomized controlled trials.
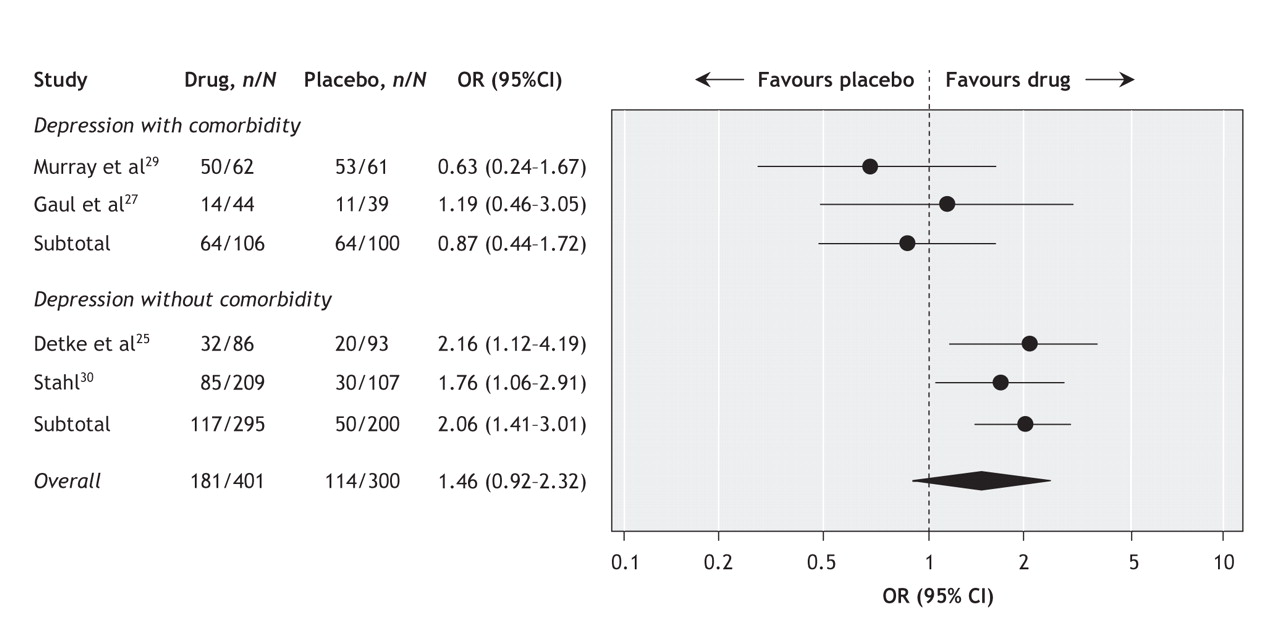
Figure 3: Pooled analysis of response to treatment (50% improvement in depression score relative to baseline) in 6 classic randomized controlled trials of selective serotonin reuptake inhibitors in patients with major depression. The vertical line represents no difference between compared treatments.
Figure 4: Pooled analysis of remission (score of 7 or below on the Hamilton rating scale for depression) in 4 classic randomized controlled trials of selective serotonin reuptake inhibitors in patients with major depression. The vertical line represents no difference between compared treatments.
Figure 5: Pooled analysis of overall acceptability (total dropouts) in 6 classic randomized controlled trials of selective serotonin reuptake inhibitors in patients with major depression. The vertical line represents no difference between compared treatments.


Tables
Table 1.

Table 2.
Table 3.


In this issue
Article tools


Jump to section
Related Articles
Cited By...
- Efficacy and acceptability of next step treatment strategies in adults with treatment-resistant major depressive disorder: protocol for systematic review and network meta-analysis
- Comparative efficacy and acceptability of antidepressants in the long-term treatment of major depression: protocol for a systematic review and networkmeta-analysis
- Bad Medicine: The rise and rise of antidepressants
- Adult Neurogenesis and Psychiatric Disorders
- Are antidepressants overprescribed? Yes
- Unhappy pills
- Trends in primary care antidepressant prescribing 1995-2007: a longitudinal population database analysis
- Prescribing safety: the case of inappropriate medicines
- Long term treatment of depression with selective serotonin reuptake inhibitors and newer antidepressants
- Bringing a research base to psychiatry
- Etablir une base de recherche en psychiatrie
More in this TOC Section
Similar Articles
Collections

