


Article Figures & Tables
Figures
Figure 1: Prevalence of hypertension in the province of Ontario from 1995 to 2005. We used a logistic regression model to adjust for age, sex, residence location (urban v. rural), socioeconomic status, presence of diabetes, 5-year history of cardiovascular disease, Charlson Comorbidity Index score, and interaction terms between age and sex. Yearly rates are based on prevalence as of Mar. 31 of each year. Results of the Pearson correlation test p < 0.001.
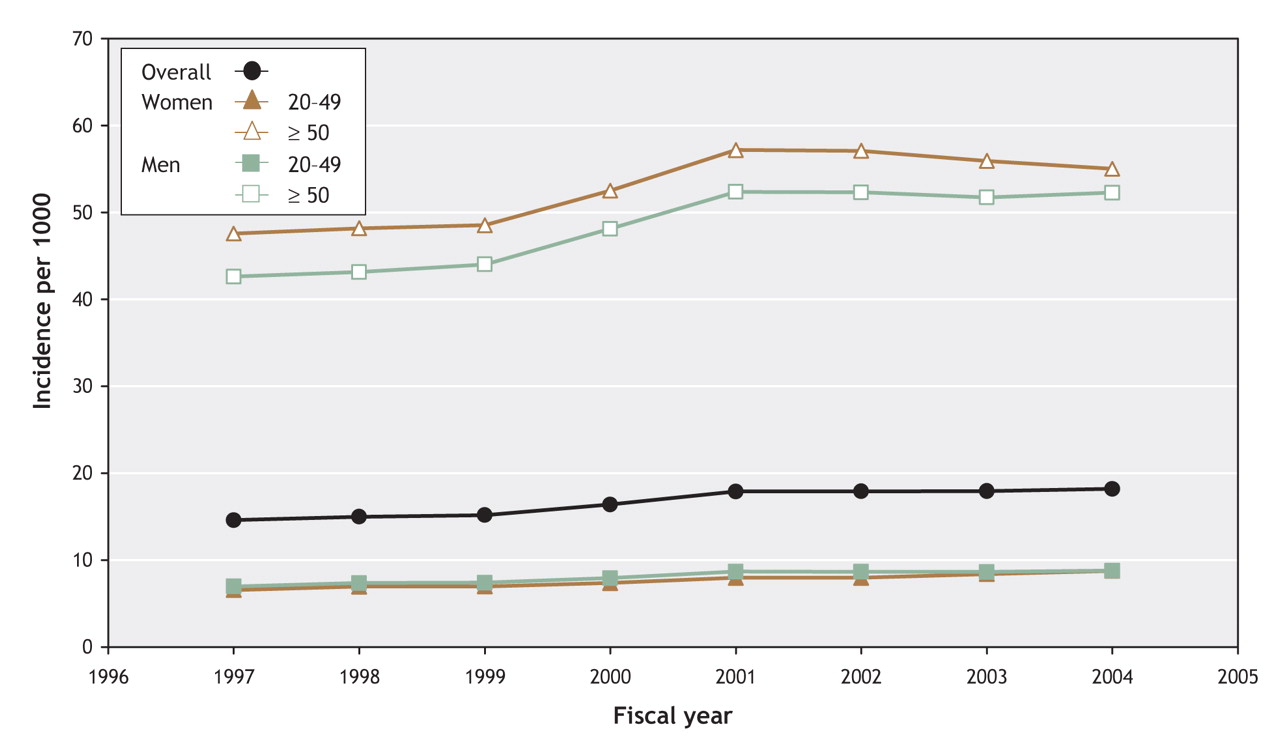
Figure 2: Incidence of hypertension in the province of Ontario from 1997 to 2004. We used a logistic regression model to adjust for age, sex, residence location (urban v. rural), socioeconomic status, presence of diabetes, 5-year history of cardiovascular disease, Charlson Comorbidity Index score, and interaction terms between age and sex. Yearly rates are based on prevalence as of Mar. 31 of each year. Results of the Pearson correlation test were p < 0.001 overall and for women and men aged 20–49 years, p = 0.007 for women aged 50 years and older and p = 0.001 for men aged 50 years and older.


Tables
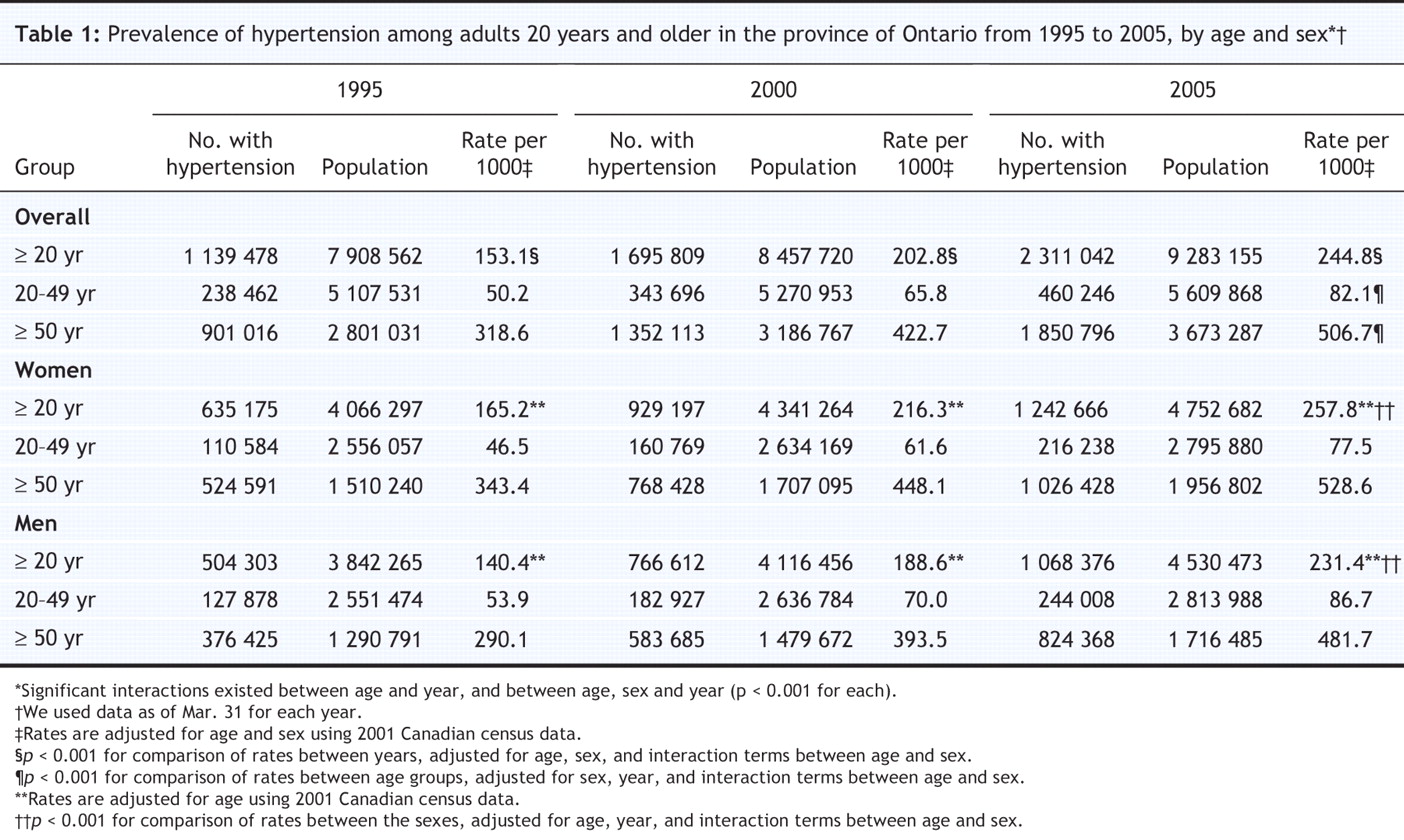
Table 1.

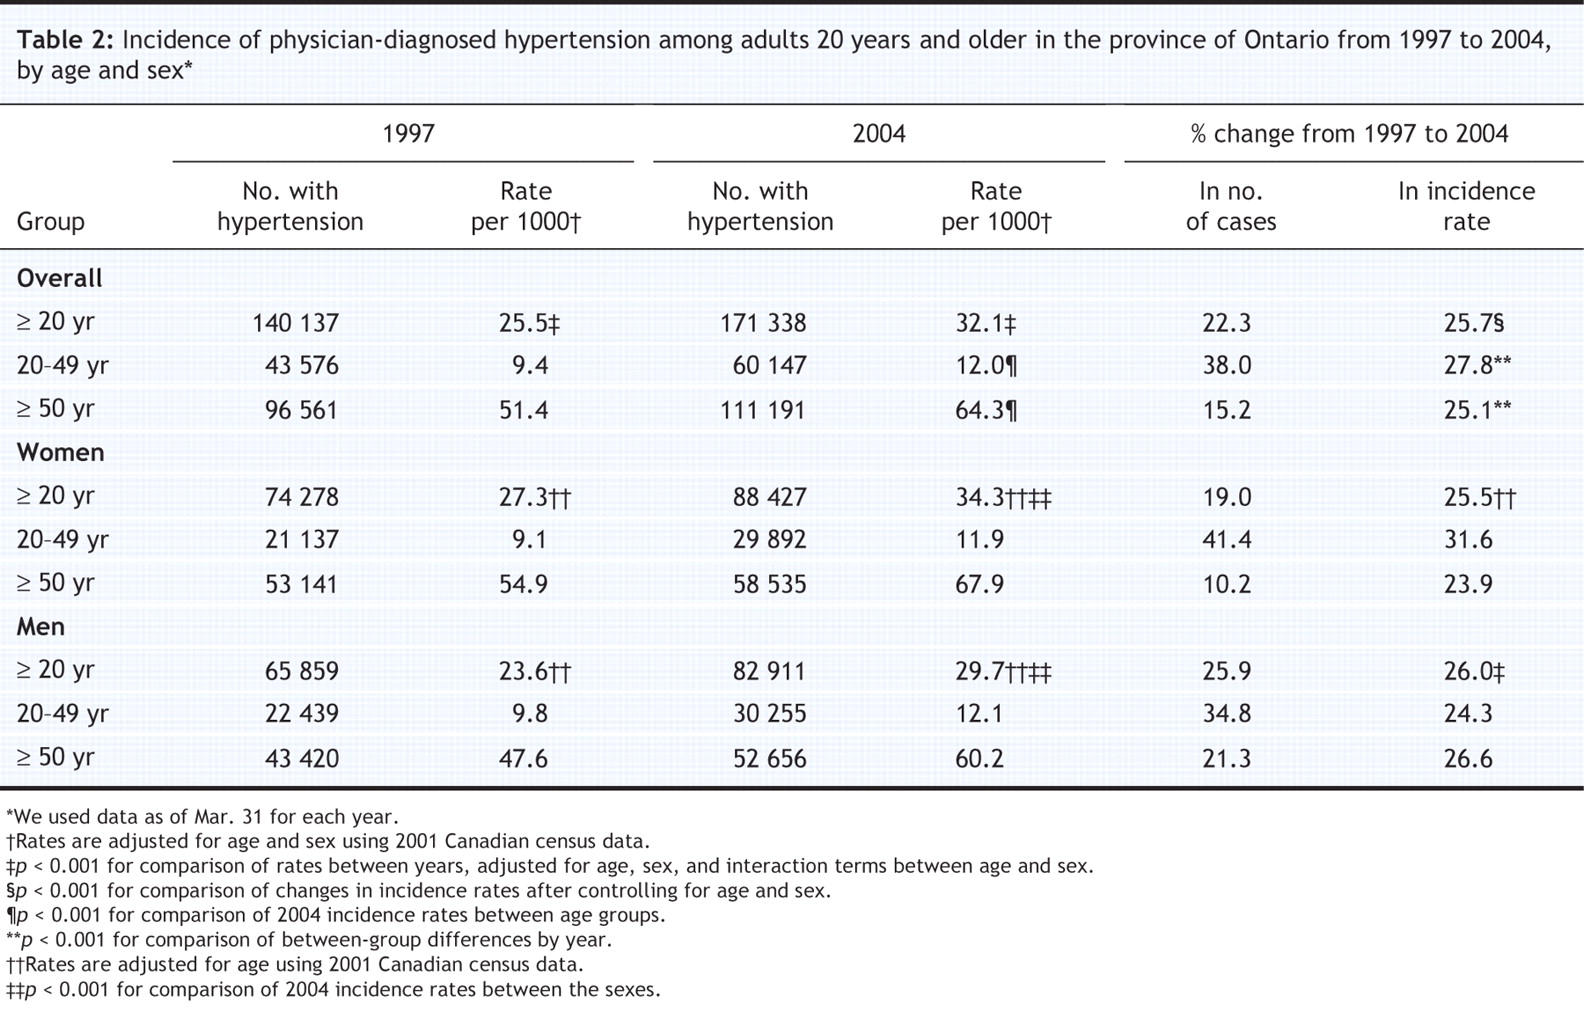
Table 2.
Table 3.

In this issue

Article tools


Jump to section
Related Articles
Cited By...
- Sex Differences in Intensity of Care and Outcomes After Acute Ischemic Stroke Across the Age Continuum
- Drivers and outcomes of variation in surgical versus transcatheter aortic valve replacement in Ontario, Canada: a population-based study
- Association of bilateral salpingo-oophorectomy with all cause and cause specific mortality: population based cohort study
- Importance of accounting for loss to follow-up when comparing mortality between immigrants and long-term residents: a population-based retrospective cohort
- Association of Neighborhood-Level Material Deprivation With Health Care Costs and Outcome After Stroke
- Incidence of Stroke in Immigrants to Canada: A Province-wide Retrospective Analysis
- Tyrosine kinase inhibitors in chronic myeloid leukaemia and emergent cardiovascular disease
- Testing, infection and complication rates of COVID-19 among people with a recent history of homelessness in Ontario, Canada: a retrospective cohort study
- Characteristics of patients with mental illness and persistent high-cost status: a population-based analysis
- Predictors of oral anticoagulant-associated adverse events in seniors transitioning from hospital to home: a retrospective cohort study protocol
- Impact of procedural capacity on transcatheter aortic valve replacement wait times and outcomes: a study of regional variation in Ontario, Canada
- The risk of death within 5 years of first hospital admission in older adults
- Examining the effects of low back pain and mental health symptoms on healthcare utilisation and costs: a protocol for a population-based cohort study
- The risk of new-onset epilepsy and refractory epilepsy in older adult stroke survivors
- Quality of primary care among individuals receiving treatment for opioid use disorder
- Association Between Cardiovascular Risk Factors and Aortic Stenosis: The CANHEART Aortic Stenosis Study
- Cost evaluation of out-of-country care for patients with eating disorders in Ontario: a population-based study
- Breast Cancer Therapy-Related Cardiac Dysfunction in Adult Women Treated in Routine Clinical Practice: A Population-Based Cohort Study
- Association of hospital and physician case volumes with cardiac monitoring and cardiotoxicity during adjuvant trastuzumab treatment for breast cancer: a retrospective cohort study
- The CANHEART health index: a tool for monitoring the cardiovascular health of the Canadian population
- Spatial Association Between Ambient Fine Particulate Matter and Incident Hypertension
- The relation between total joint arthroplasty and risk for serious cardiovascular events in patients with moderate-severe osteoarthritis: propensity score matched landmark analysis
- Economic Evaluation of Percutaneous Left Atrial Appendage Occlusion, Dabigatran, and Warfarin for Stroke Prevention in Patients With Nonvalvular Atrial Fibrillation
- Early cholecystectomy for acute cholecystitis: a population-based retrospective cohort study of variation in practice
- Diagnosed hypertension in Canada: incidence, prevalence and associated mortality
- Changes in the rates of awareness, treatment and control of hypertension in Canada over the past two decades
- Newly diagnosed diabetes mellitus as a risk factor for serious liver disease
- Incidence and Predictors of Hypertension Among Rural Chinese Adults: Results From Liaoning Province
- Trends in risk factors for cardiovascular disease in Canada: temporal, socio-demographic and geographic factors
- L'hypertension et le medecin de famille
- Prise en charge de l'hypertension par les medecins de famille: Est-ce le temps de nous feliciter?
- Hypertension and the family physician
- Hypertension management by family physicians: Is it time to pat ourselves on the back?
- Comparison of primary care physician payment models in the management of hypertension
- S'attaquer au fardeau de l'hypertension au Canada: Encourager les soins en collaboration
- Tackling the burden of hypertension in Canada: Encouraging collaborative care
- Hypertension in children and adolescents
- Hypertension management in Canada: good news, but important challenges remain
- Mortality among patients with hypertension from 1995 to 2005: a population-based study
More in this TOC Section
Similar Articles
Collections

