


Article Figures & Tables
Figures
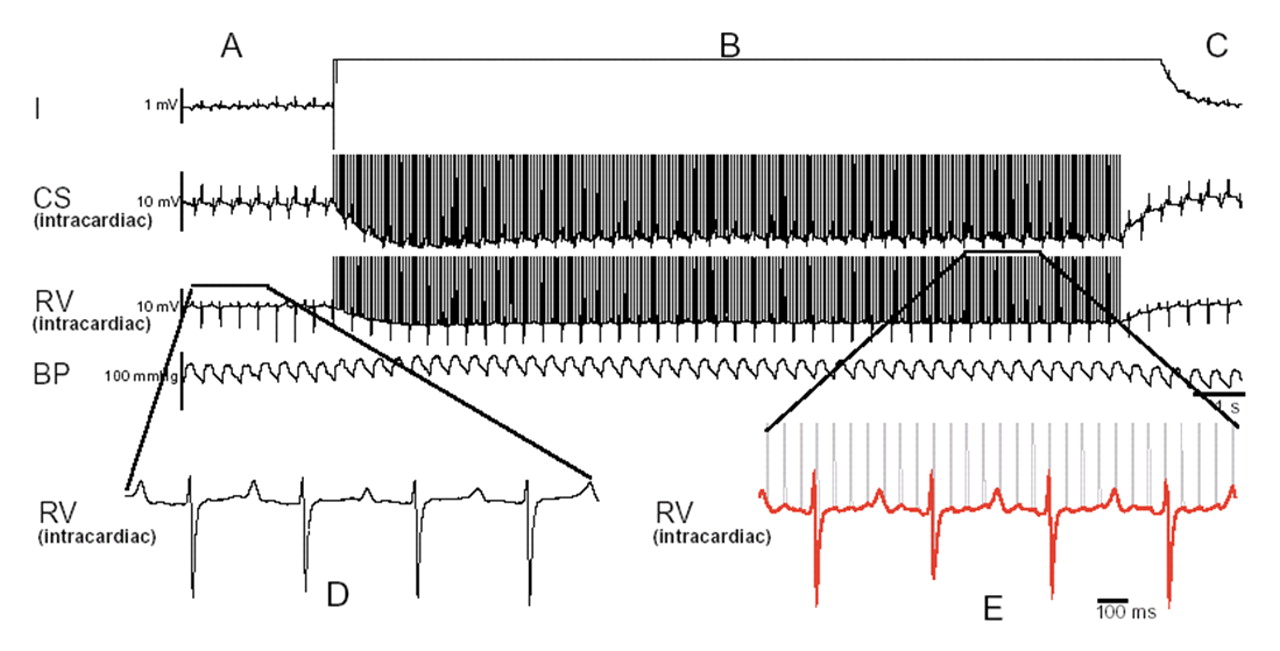
Figure 1: Cardiac stimulation and hypotension from a stun gun discharge. Note the corruption of the surface electrocardiographic leads in panel B and the electrical activity of the intracardiac electrograms. After stun gun discharge, a spontaneous and immediate return of regular sinus rhythm and blood pressure occurs (panel C). Panel D and E show magnified intracardiac electrograms of similar duration. It is evident in panel E that the rate is much faster and the rhythm is wider than in panel D. The morphology of the tachycardia in panel E is wider than the morphology in panel D. There is a constant stun gun stimulus artifact to electrogram duration as illustrated in panel E, with every fourth stun gun discharge resulting in stimulation of the heart. Note the loss of blood pressure during the stimulation and the recovery of blood pressure once the discharge is completed. Reproduced with permission from Elsevier (Nanthakumar et al24). Note: CS = coronary sinus, RV = right ventricular, BP = blood pressure.
Figure 2: A typical episode of a stun gun shock across the abdomen (nonthoracic vector) that does not result in stimulation of the myocardium. The surface electrocardiogram lead 1, intracardiac electrograms from the coronary sinus, the right ventricle apex and blood pressure in the descending aorta are shown. Panel A illustrates the regular rhythm before the discharge, which is very similar to the rhythm and rate in panel C. The intracardiac electrograms, as illustrated in panels D and E, do not show any significant change in rate morphology and are not phase-locked (no temporal relation between stimuli and the electrogram) with the stun gun discharge. Note also the lack of perturbation of blood pressure during the discharge. Reproduced with permission from Elsevier (Nanthakumar et al24). Note: CS = coronary sinus, RV = right ventricular, BP = blood pressure.
Figure 3: Magnified summed intracardiac electrograms from a patient's internal pacemaker log during stun gun discharge. Cardiac capture is shown by the high-rate ventricular sensing (cycle length 203–289 milliseconds); the cyclic, low-frequency modulation of high-frequency noise (stun gun pulses) during ventricular sensing; a single, long ventricular interval (648 milliseconds) after the energy stops; and postdischarge resumption of atrial and ventricular sensing at a rate similar to predischarge cardiac rate. The high-frequency pulses (15 pps, 66 milliseconds) are labelled on the tracing. The intracardiac electrograms from the last sensed ventricular event during stun gun application are superimposed on each prior ventricular sensed event, showing that the disruption of the high-frequency stun gun signal is consistent with modulation of the signal by a repeating R wave with morphology different than the intrinsic R wave (right side of the image). Reproduced with permission from Blackwell (Cao et al26).


Tables
Table 1.


In this issue

Article tools


Jump to section
- Article
- Abstract
- Stun gun discharges
- Method of stunning
- Electrical stimulation of the heart
- Effect of external electrical discharges on the heart
- Evidence that stun guns cannot stimulate the heart
- Evidence that stun guns can stimulate the heart
- Explaining the discrepancies between theory and observation
- Knowledge gaps
- Conclusions
- Footnotes
- REFERENCES
- Figures & Tables
- Related Content
- Responses
- Metrics
Related Articles
Cited By...
More in this TOC Section
Similar Articles
Collections

