


Article Figures & Tables
Figures
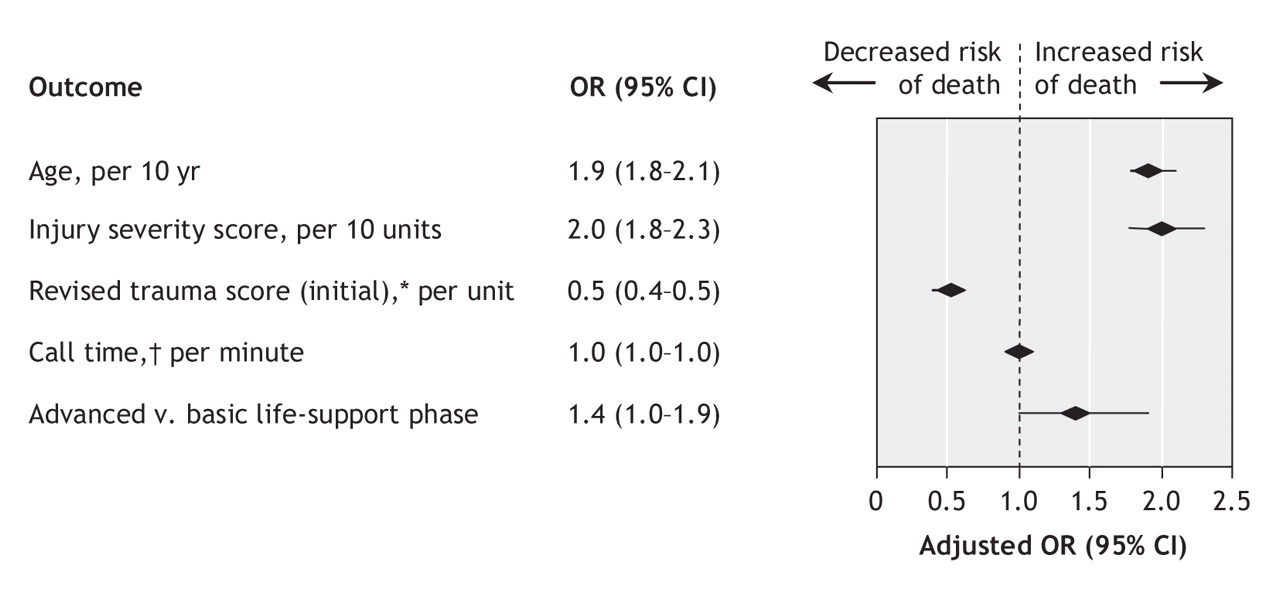
Figure 1: Adjusted odds ratios (ORs) and 95% confidence intervals (CIs) evaluating factors associated with mortality at hospital discharge. Model incorporates study phase and final (hospital) revised trauma score as predictors of mortality. Goodness-of-fit: p > 0.20. *Final assessment of revised trauma score represents value from lead trauma hospital; if missing, the value from the scene was used. †Time from call received to arrival of crew at patient side.
Figure 2: Adjusted odds ratios (ORs) and 95% confidence intervals (CIs) evaluating factors associated with mortality at hospital discharge. Model incorporates study phase and initial (field) revised trauma score as predictors of mortality. Goodness-of-fit: p > 0.20. *Initial assessment of revised trauma score represents value from the scene; if missing, the value from the lead trauma hospital was used. †Time from call received to arrival of crew at patient side.
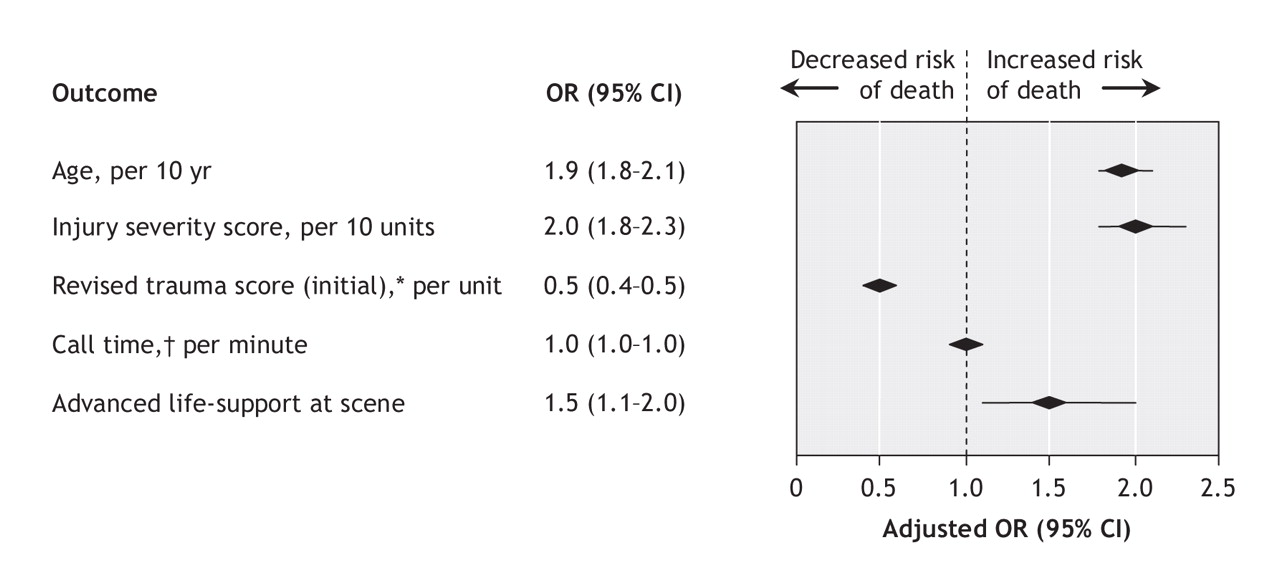
Figure 3: Adjusted odds ratios (ORs) and 95% confidence intervals (CIs) evaluating factors associated with mortality at hospital discharge. Model incorporates advanced life-support provided at the scene as predictor of mortality. Goodness-of-fit: p > 0.20. *Initial assessment of revised trauma score represents value from the scene; if missing, the value from the lead trauma hospital was used. †Time from call received to arrival of crew at patient side.
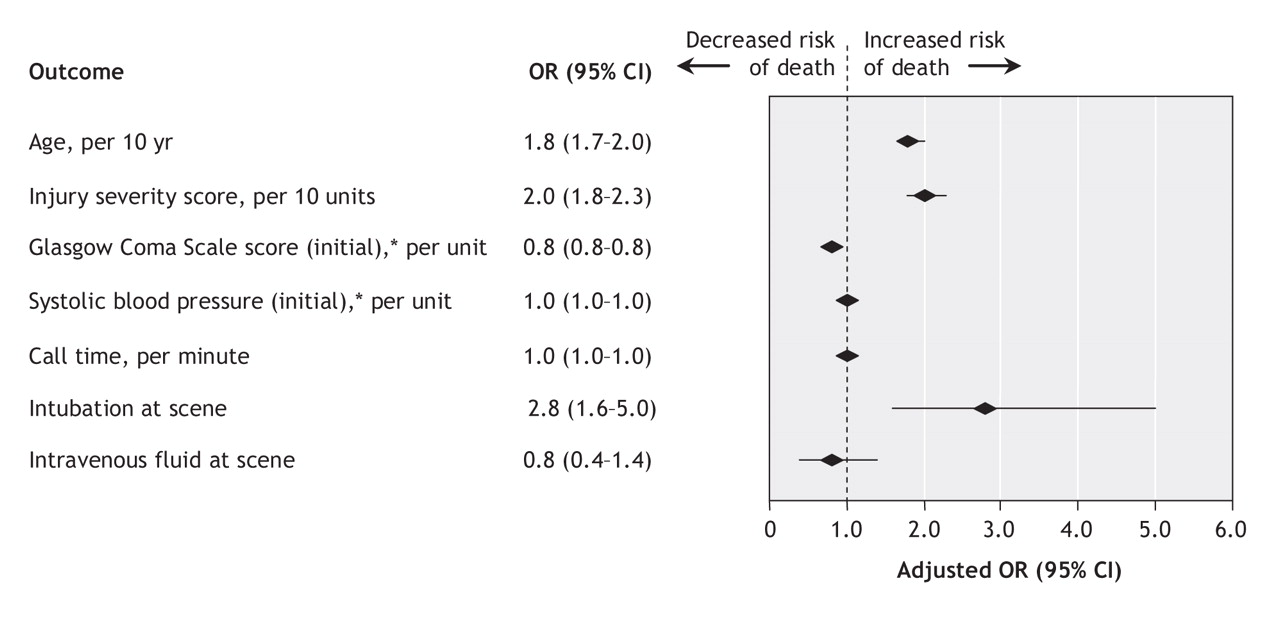
Figure 4: Adjusted odds ratios (ORs) and 95% confidence intervals (CIs) evaluating factors associated with mortality at hospital discharge. Model incorporates advanced life-support interventions as predictors of mortality. Goodness-of-fit: p > 0.20. *Initial assessments of Glasgow Coma Scale score and systolic blood pressure represent values from the scene; if missing, the value from the lead trauma hospital was used. †Time from call received to arrival of crew at patient side.


Tables
Table 1.

Table 2.
Table 3.
Table 4.
Table 5.


In this issue

Article tools


Jump to section
Related Articles
Cited By...
- Comparison of kinetic changes during helicopter medical evacuations: civilian versus military flights
- Multicentre observational study on practice of prehospital management of hypotensive trauma patients: the SPITFIRE study protocol
- Injury-related deaths in the Ontario provincial trauma system: a retrospective population-based cohort analysis
- The care and transport of trauma victims by layperson emergency medical systems: a qualitative study in Delhi, India
- A traumatic tale of two cities: does EMS level of care and transportation model affect survival in patients with trauma at level 1 trauma centres in two neighbouring Canadian provinces?
- Effects of advanced life support versus basic life support on the mortality rates of patients with trauma in prehospital settings: a study protocol for a systematic review and meta-analysis
- Characteristics and prognoses of patients treated by an anaesthesiologist-manned prehospital emergency care unit. A retrospective cohort study
- Prehospital management and identification of sepsis by emergency medical services: a systematic review
- Outcome following physician supervised prehospital resuscitation: a retrospective study
- Emergency medical services versus private transport of trauma patients in the Sultanate of Oman: a retrospective audit at the Sultan Qaboos University Hospital
- Prehospital non-drug assisted intubation for adult trauma patients with a Glasgow Coma Score less than 9
- The impact of intense airway management training on paramedic knowledge and confidence measured before, immediately after and at 6 and 12 months after training
- A simple three-step dispatch rule may reduce lights and sirens responses to motor vehicle crashes
- Period of Irreversible Therapeutic Intervention during Sepsis Correlates with Phase of Innate Immune Dysfunction
- Population density and mortality among individuals in motor vehicle crashes
- Predictors of Survival From Out-of-Hospital Cardiac Arrest: A Systematic Review and Meta-Analysis
- Prehospital and in-hospital advanced life-support
- Should invasive airway management be done in the field?
More in this TOC Section
Similar Articles
Collections

