


Article Figures & Tables
Figures
Figure 1: Retrieval and selection of studies involving patients taking oral anticoagulants that captured hemorrhagic or thromboembolic events and person-years of observation.
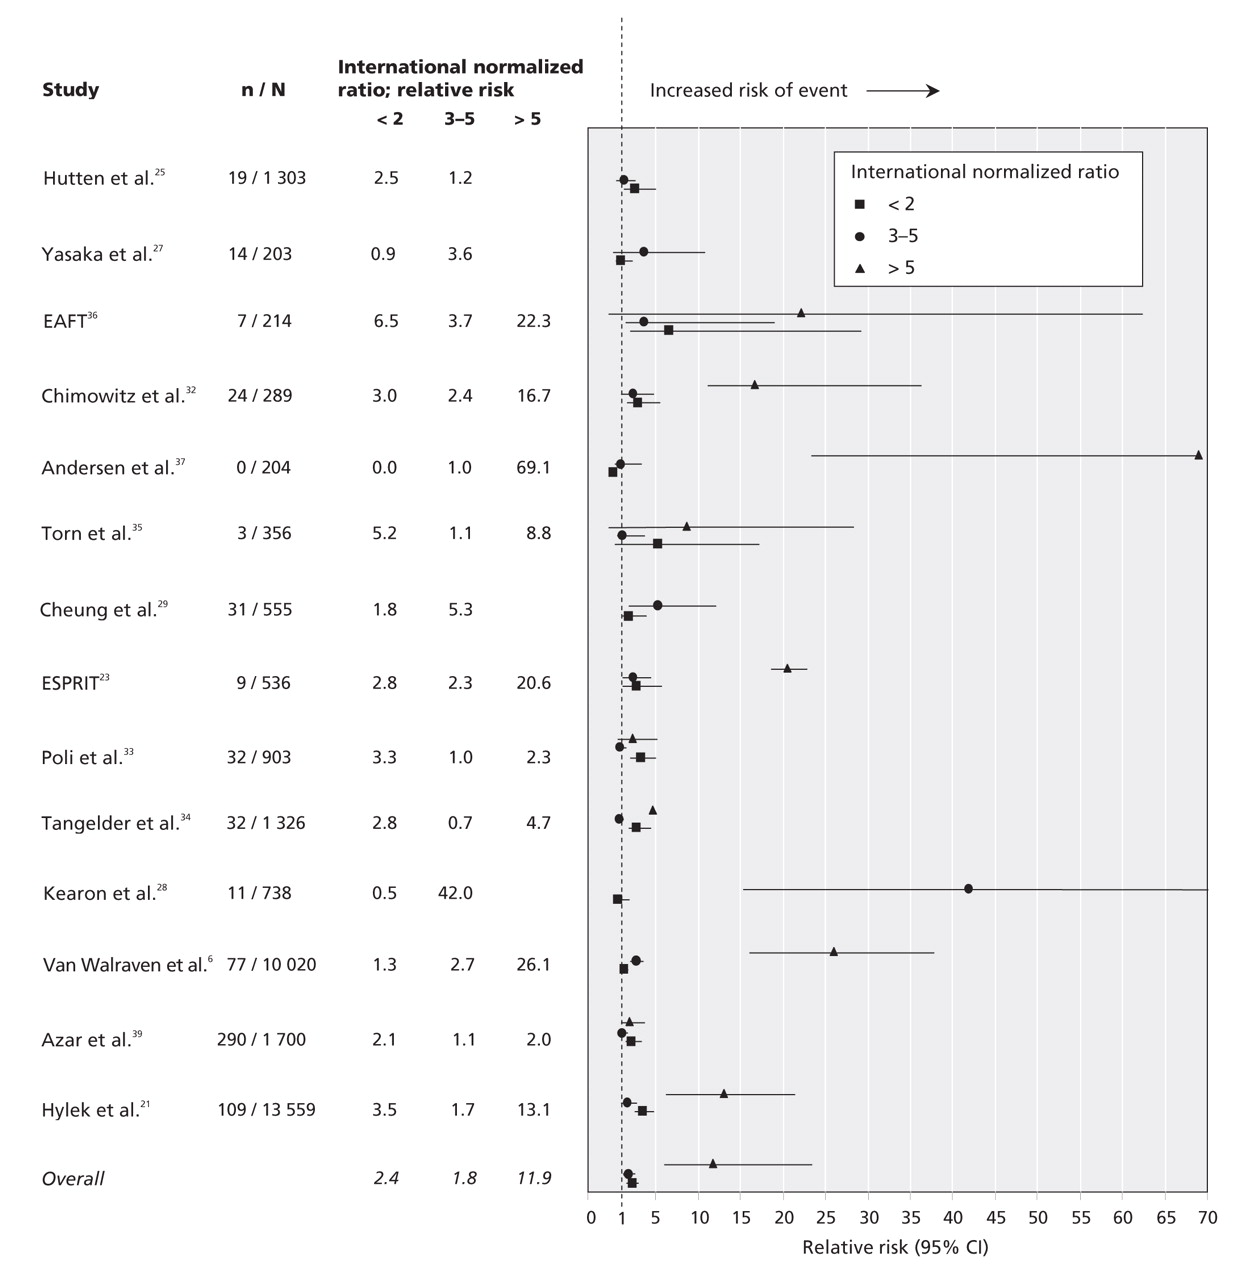
Figure 2: Anticoagulation intensity and risk of hemorrhagic events. An international normalized ratio of 2–3 was the reference range. Studies that did not report events at a ratio greater than 5 reported a maximum range of ratio greater than 3. We grouped these data into the range of 3–5. CI = confidence interval, EAFT = European Atrial Fibrillation Trial Study Group, ESPRIT = European and Australian Stroke Prevention in Reversible Ischaemia Trial, RR = relative risk. Confidence intervals are in Appendix 5, available online at www.cmaj.ca/cgi/content/full/179/3/235/DC2.
Figure 3: Anticoagulation intensity and risk of thromboembolic events. An international normalized ratio of 2–3 was the reference range. Studies that did not report events at a ratio greater than 5 reported a maximum range of ratio greater than 3. We grouped these data into the range of 3–5. CI = confidence interval, EAFT = European Atrial Fibrillation Trial Study Group, ESPRIT = European and Australian Stroke Prevention in Reversible Ischaemia Trial, RR = relative risk. Confidence intervals are in Appendix 5, available online at www.cmaj.ca/cgi/content/full/179/3/235/DC2.
Figure 4: Anticoagulation intensity and risk of hemorrhagic or thromboembolic events combined. An international normalized ratio of 2–3 was the reference range. Studies that did not report events at a ratio greater than 5 reported a maximum range of ratio greater than 3. We grouped these data into the range of 3–5. CI = confidence interval, EAFT = European Atrial Fibrillation Trial Study Group, ESPRIT = European and Australian Stroke Prevention in Reversible Ischaemia Trial, RR = relative risk. Confidence intervals are in Appendix 5, available online at www.cmaj.ca/cgi/content/full/179/3/235/DC2.


Tables
Table 1.

Table 2.


In this issue
Article tools


Jump to section
Related Articles
Cited By...
- Reversing vitamin K antagonists: making the old new again
- Implementing Evidence-Based Guidelines: The Role of Ambulatory Care Pharmacists
- Menaquinones, Bacteria, and the Food Supply: The Relevance of Dairy and Fermented Food Products to Vitamin K Requirements
- Efficacy and Safety of Apixaban Compared With Warfarin at Different Levels of Predicted International Normalized Ratio Control for Stroke Prevention in Atrial Fibrillation
- Apixaban Compared With Warfarin for Stroke Prevention in Atrial Fibrillation: Implications of Time in Therapeutic Range
- Point of Care INR testing devices: performance of the Roche CoaguChek XS and XS Plus in the UK NEQAS BC external quality assessment programme for healthcare professionals: four years' experience
- Prospective evaluation of a pharmacogenetics-guided warfarin loading and maintenance dose regimen for initiation of therapy
- Low-Intensity Adjusted-Dose Warfarin for the Prevention of Hemodialysis Catheter Failure: A Randomized, Controlled Trial
- Should Patient Characteristics Influence Target Anticoagulation Intensity for Stroke Prevention in Nonvalvular Atrial Fibrillation?: The ATRIA Study
- Effect of an interactive voice response system on oral anticoagulant management
- A higher international normalized ratio may be better for your patient
More in this TOC Section
Similar Articles
Collections

