


Article Figures & Tables
Figures
Figure 1: Population rates of community-acquired Clostridium difficile-associated diarrhea among people 65 years and older who required hospital admission in Quebec. Error bars = 95% confidence intervals.
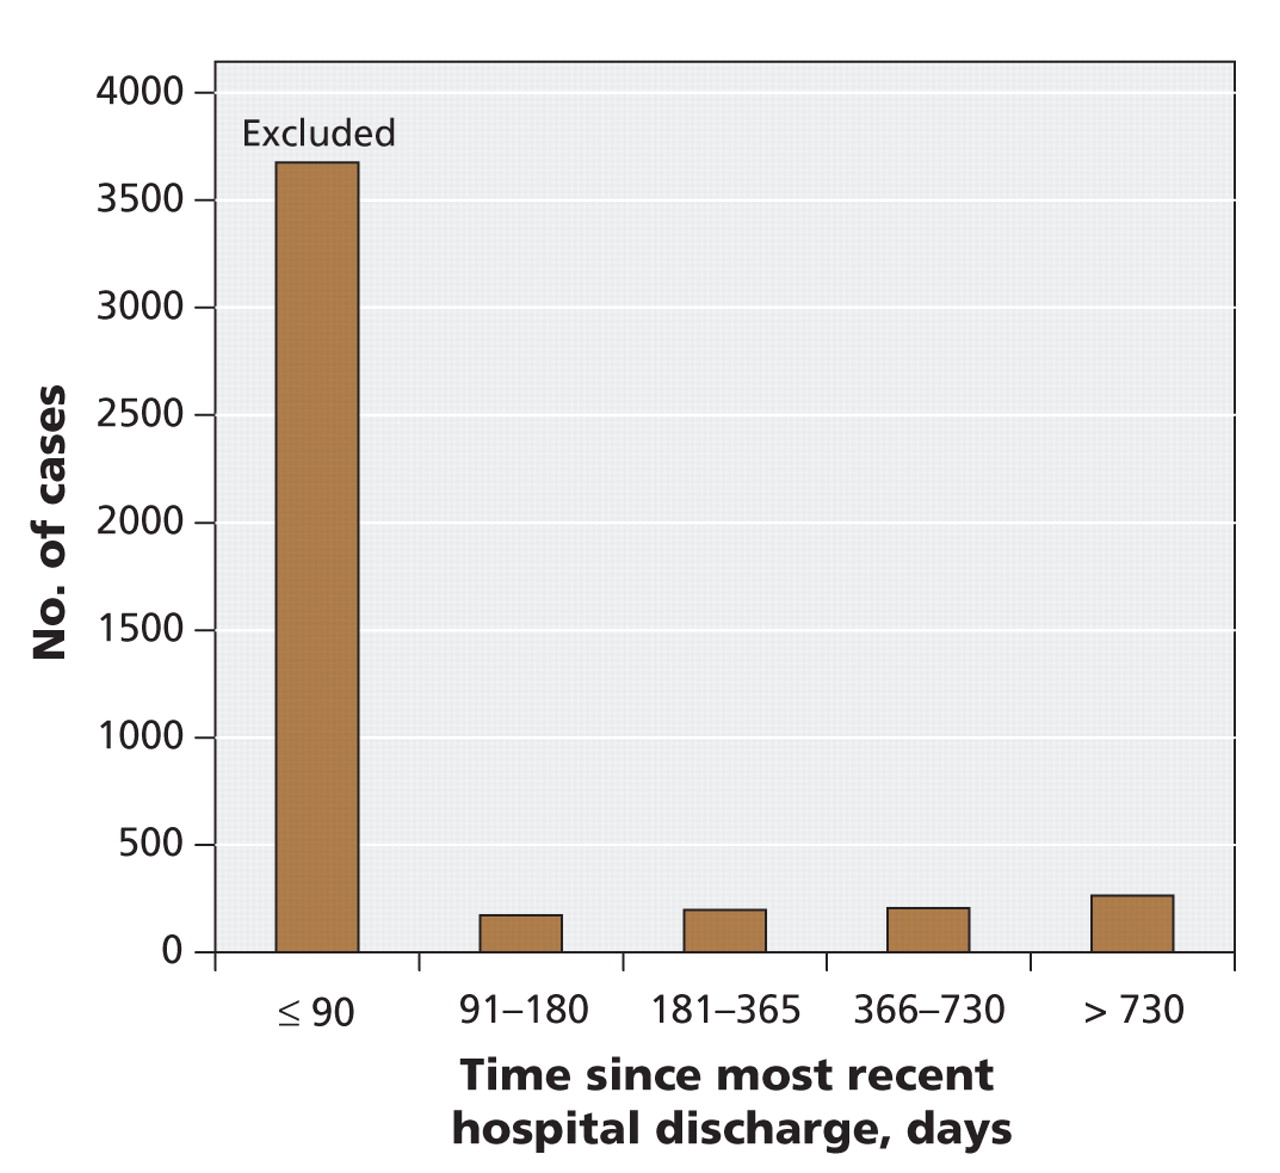
Figure 2: Distribution of community-acquired Clostridium difficile-associated diarrhea as a function of time from hospital admission in the 2 years before the index admission.
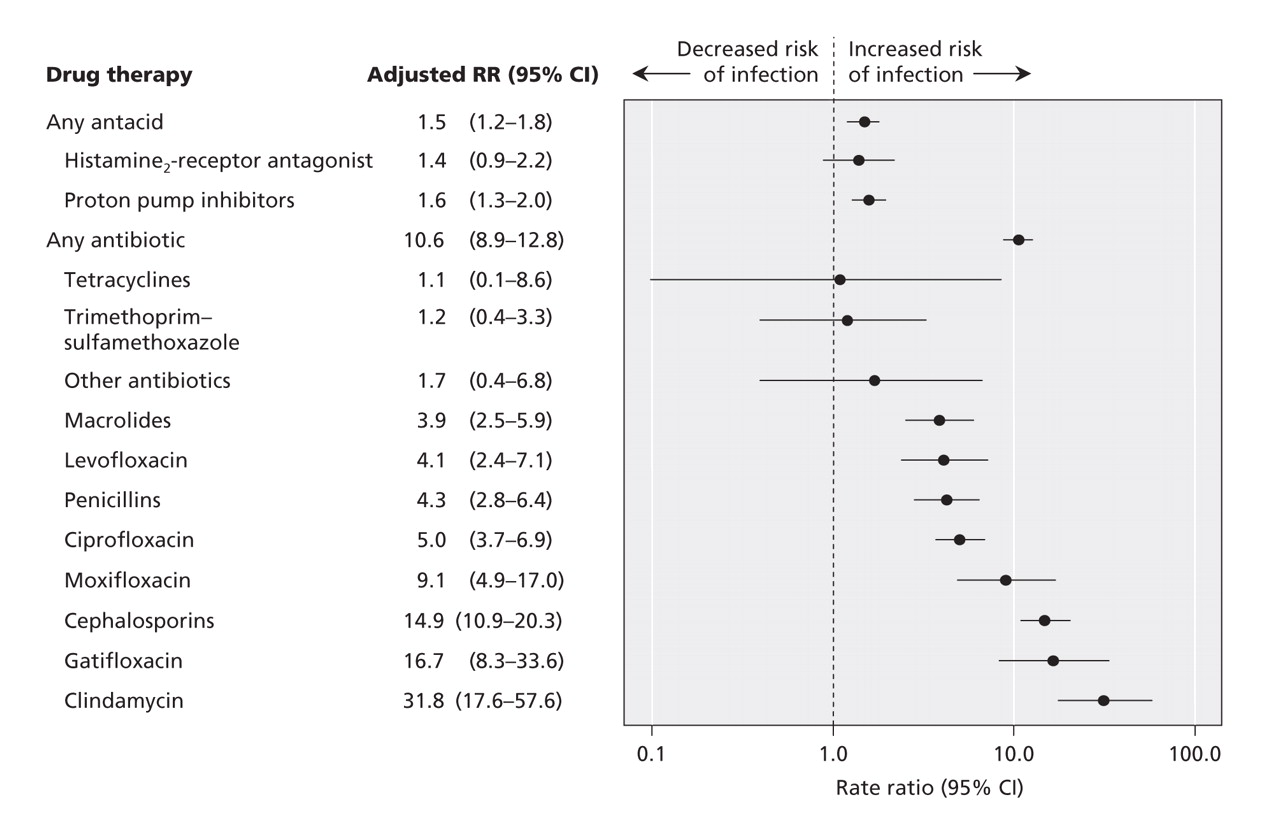
Figure 3: Adjusted rate ratios (RRs) of Clostridium difficile infection among patients exposed to antibiotics and gastric suppressive therapy in the 45 days before the index date compared with patients not exposed in that period. Adjustments were made for the variables in Table 1 and for the agents listed in the above figure. CI = 95% confidence interval.
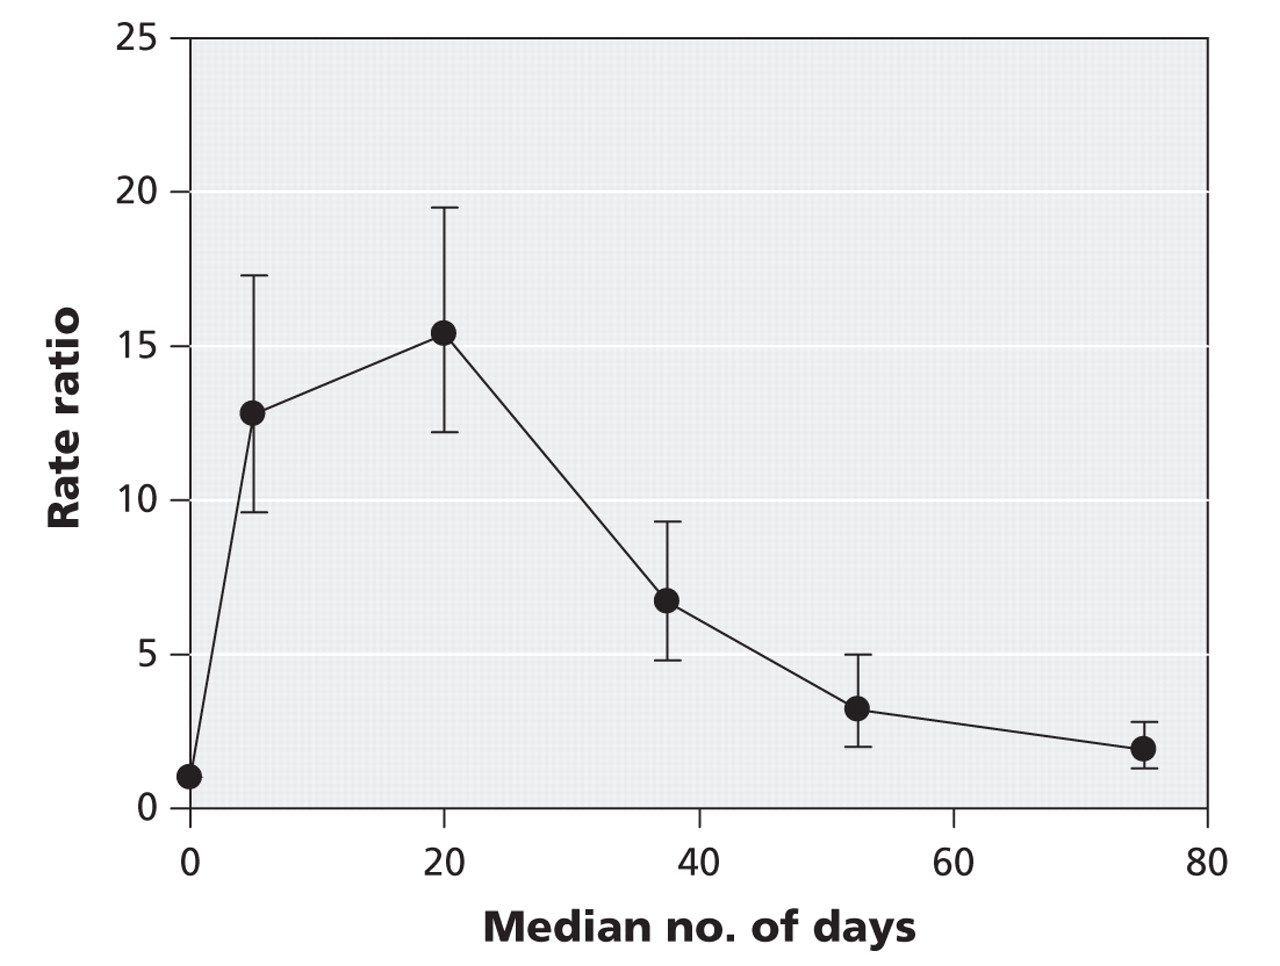
Figure 4: Risk of hospital admission because of Clostridium difficile infection as a function of time from most recent antibiotic prescription. Values shown are rate ratios for patients with C. difficile infection (n = 836) relative to those without C. difficile infection (n = 8360).

Tables
Table 1.


In this issue
Article tools


Jump to section
Related Articles
Cited By...
- Effect of a Health Care System Respiratory Fluoroquinolone Restriction Program To Alter Utilization and Impact Rates of Clostridium difficile Infection
- Probiotics for the prevention of Clostridium difficile
- Are There Reasons To Prefer Tetracyclines to Macrolides in Older Patients with Community-Acquired Pneumonia?
- Meta-Analysis of Antibiotics and the Risk of Community-Associated Clostridium difficile Infection
- Seasonal Variations in Clostridium difficile Infections Are Associated with Influenza and Respiratory Syncytial Virus Activity Independently of Antibiotic Prescriptions: a Time Series Analysis in Quebec, Canada
- The Changing Epidemiology of Clostridium difficile Infections
- Prevention and medical management of Clostridium difficile infection
- A diarrhoeal illness with a difference?
- The role of surgery in Clostridium difficile colitis
- Use administrative databases with caution
- Use administrative databases with caution
- Spectrum of Clostridium difficile infections outside health care facilities
More in this TOC Section
Similar Articles

