


Article Figures & Tables
Figures
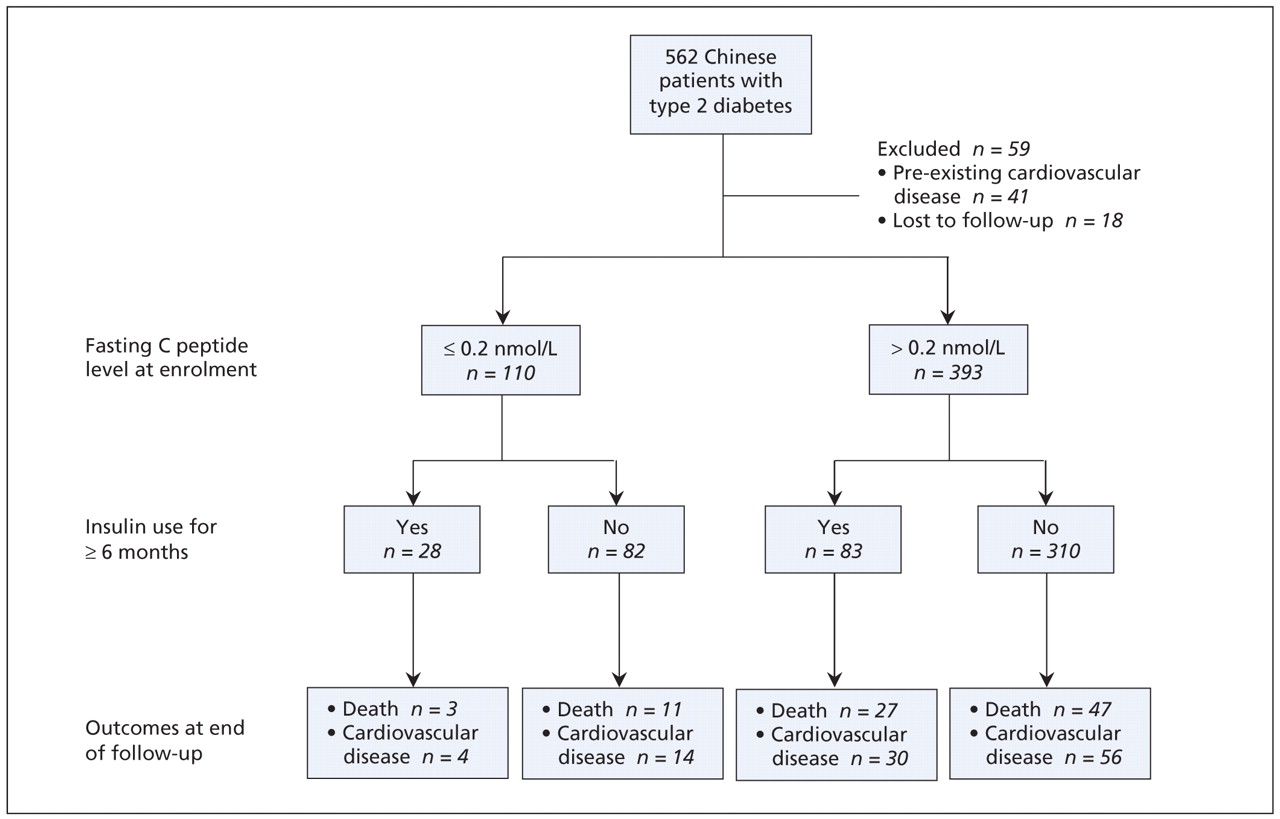
Figure 1: Clinical outcomes of 503 patients with type 2 diabetes mellitus stratified by baseline fasting C peptide levels and status of insulin use. Analysis of variance for comparison of the 4 groups:p < 0.001.
Figure 2: Incidence of death (top panel) and new-onset cardiovascular disease (bottom panel) among 503 patients with type 2 diabetes, by baseline fasting C peptide level and insulin use. Note: I+ = insulin use, I− = no insulin use, CP+ = normal to high C peptide level, CP− = low C peptide level.

Tables
Table 1: Independent factors associated with outcomes

Table 2: Subgroup analysis of independent factors associated with outcomes


In this issue
Article tools
Respond to this article


Jump to section
Related Articles
Cited By...
- Higher habitual FODMAP intake is associated with lower body mass index, lower insulin resistance and higher short-chain fatty acid-producing microbiota in people with prediabetes
- Assessment of Insulin Administration Methods: Perceptions by Patients and Significant Others Instrument Development
- Combien dheures les medecins residents devraient-ils travailler?
- How many hours should a surgical resident work?
- Cardiovascular risk and glycemic control
More in this TOC Section
Similar Articles

