


Article Figures & Tables
Figures
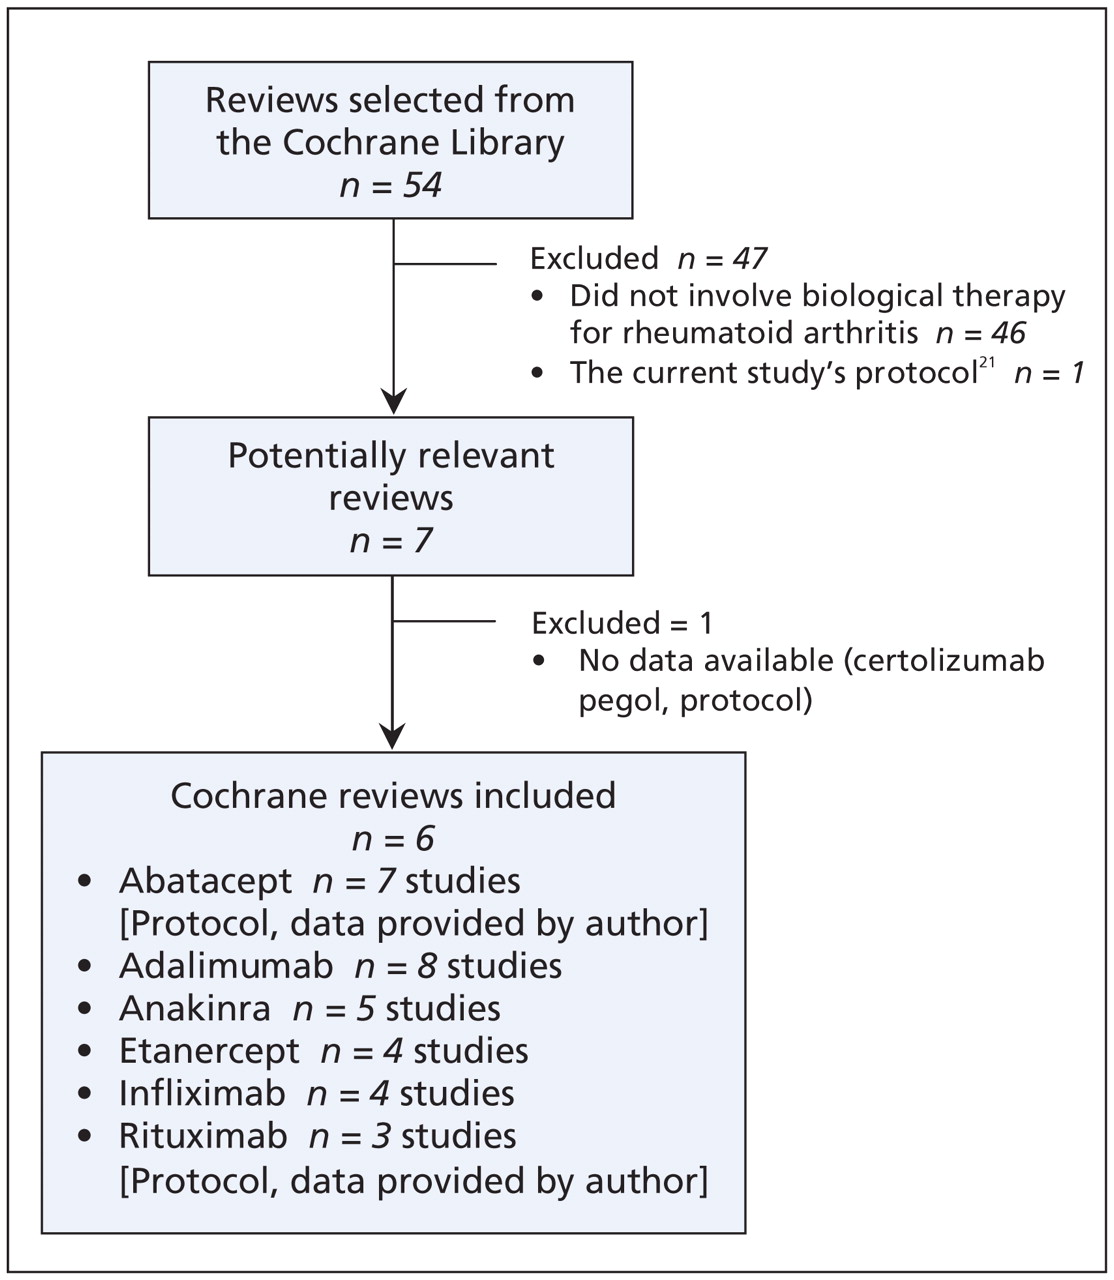
Figure 1: Flow chart for selection of systematic reviews included in the overview of systematic reviews of biologics for treatment of rheumatoid arthritis.
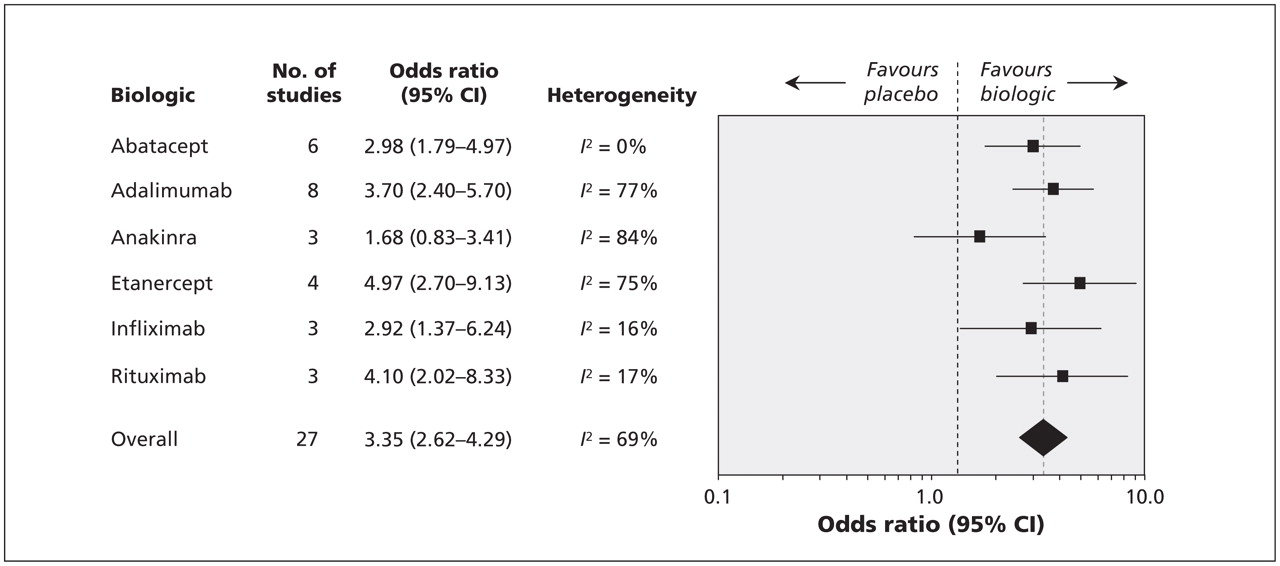
Figure 2: Comparison of each biologic to placebo for benefit (defined as a 50% improvement in patient- and physician-reported criteria of the American College of Rheumatology [ACR50]). A value greater than 1.0 indicates a benefit from the biologic. CI = confidence interval. For details of studies included for each biologic, refer to Appendix 2 (avaiable at www.cmaj.ca/cgi/content/full/cmaj.091391/DC1).
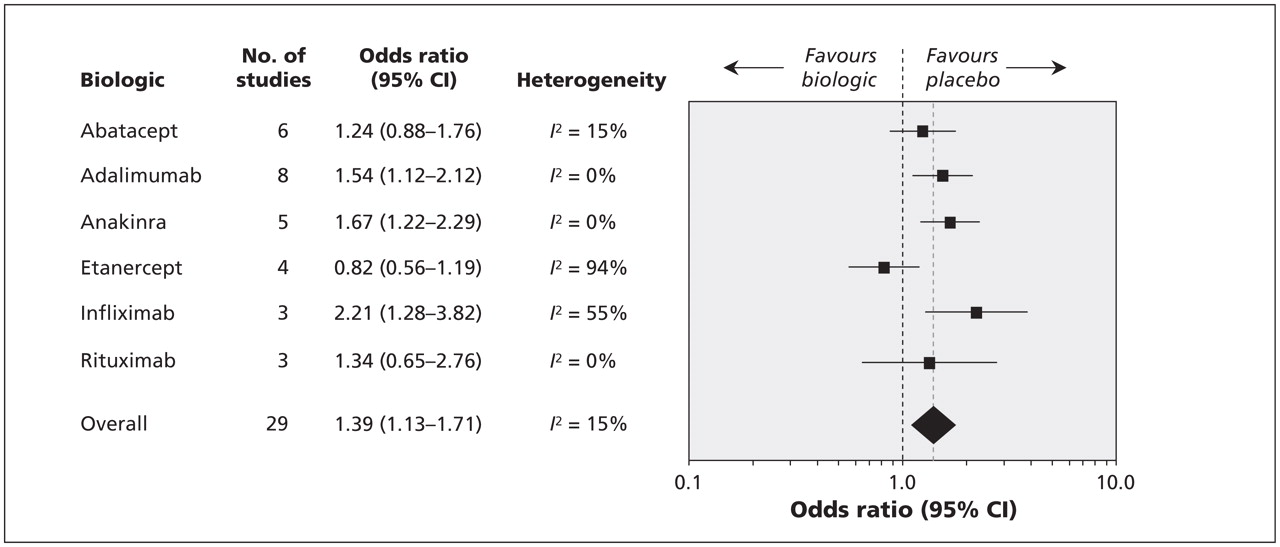
Figure 3: Comparison of each biologic to placebo for safety (deterined by number of withdrawals because of adverse events). A value less than 1.0 indicates a benefit from the biologic. CI = confidence interval. For details of the studies included for each biologic, refer to Appendix 2 (avaiable at www.cmaj.ca/cgi/content/full/cmaj.091391/DC1).
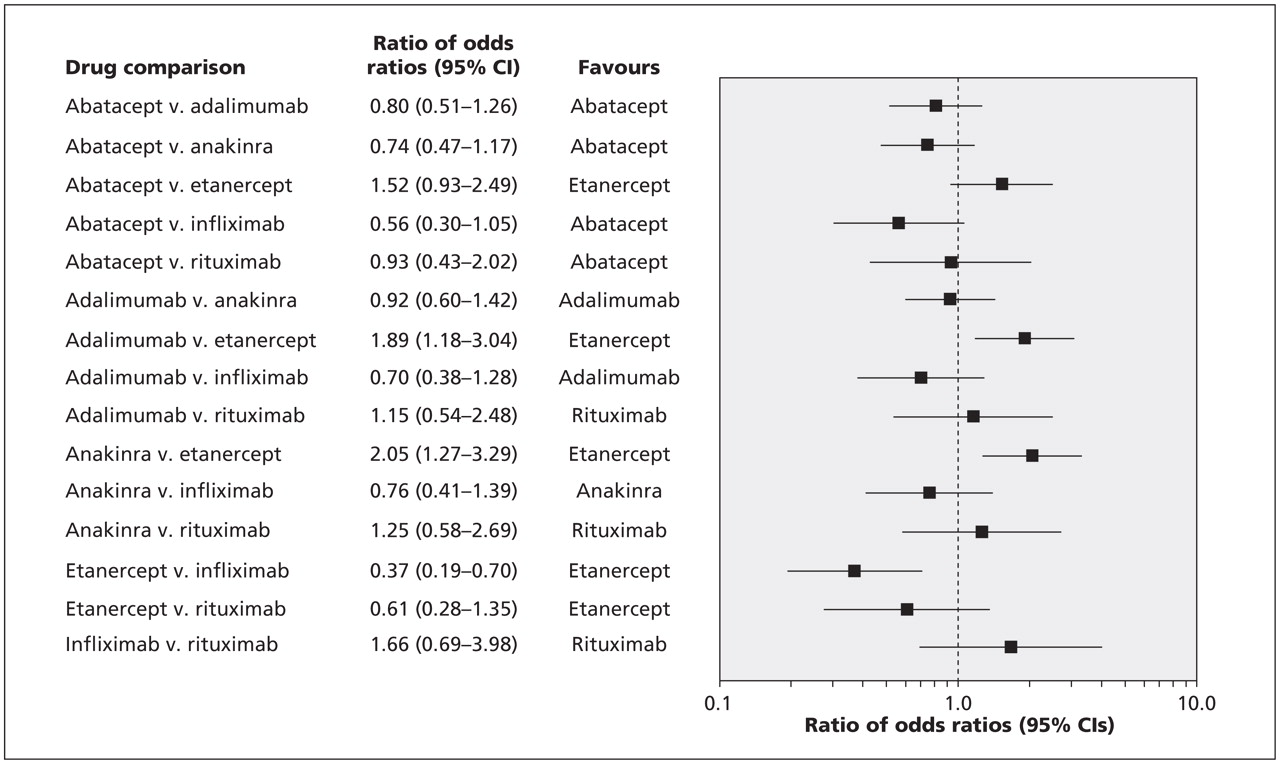
Figure 4: Indirect comparison of each biologic to each other for benefit (ACR50). A value greater than 1.0 indicate a benefit from the biologic. CI = confidence interval. I2 values for the studies are presented in Figure 2.
Figure 5: Indirect comparison of biologics to each other for safety (determined by number of withdrawals because of adverse events). A value greater than 1.0 indicate a benefit from the biologic. CI = confidence interval. I2 values for the studies are presented in Figure 2.


Tables
Table 1: Characteristics of the inclusion criteria and the patient populations of the included reviews

Table 2: Summary of the findings of meta-analyses of biologics for rheumatoid arthritis
Table 3: Stratified meta-analyses for benefit and safety for biologics used in the treatment of rheumatoid arthritis


In this issue
Article tools


Jump to section
Related Articles
Cited By...
- Disease activity-guided dose optimisation of adalimumab and etanercept is a cost-effective strategy compared with non-tapering tight control rheumatoid arthritis care: analyses of the DRESS study
- Improving patient-centred care for rheumatoid arthritis
- Risk of hospitalised infection in rheumatoid arthritis patients receiving biologics following a previous infection while on treatment with anti-TNF therapy
- Disease activity guided dose reduction and withdrawal of adalimumab or etanercept compared with usual care in rheumatoid arthritis: open label, randomised controlled, non-inferiority trial
- Tumour necrosis factor inhibitors versus combination intensive therapy with conventional disease modifying anti-rheumatic drugs in established rheumatoid arthritis: TACIT non-inferiority randomised controlled trial
- Discontinuation of infliximab therapy in patients with Crohn's disease in sustained complete remission (the STOP IT study): protocol for a double-blind, randomised, placebo-controlled, multicentre trial
- Antipsychotic treatment for children and adolescents with schizophrenia spectrum disorders: protocol for a network meta-analysis of randomised trials
- Efficacy of biological agents in juvenile idiopathic arthritis: a systematic review using indirect comparisons
- Tabalumab, an anti-BAFF monoclonal antibody, in patients with active rheumatoid arthritis with an inadequate response to TNF inhibitors
- Novel targeted therapies: the future of rheumatoid arthritis? Mavrilumab and tabalumab as examples
- Why the findings of published multiple treatment comparison meta-analyses of biologic treatments for rheumatoid arthritis are different: an overview of recurrent methodological shortcomings
- Use of biologics in a patient with rheumatoid arthritis refractory to methotrexate
- Updated consensus statement on biological agents for the treatment of rheumatic diseases, 2012
- Comparative effectiveness and safety of biological treatment options after tumour necrosis factor {alpha} inhibitor failure in rheumatoid arthritis: systematic review and indirect pairwise meta-analysis
- Drug therapy of inflammatory arthritis
- A mindfulness-based group intervention to reduce psychological distress and fatigue in patients with inflammatory rheumatic joint diseases: a randomised controlled trial
- Updated consensus statement on biological agents for the treatment of rheumatic diseases, 2011
- Change in the discontinuation pattern of tumour necrosis factor antagonists in rheumatoid arthritis over 10 years: data from the Spanish registry BIOBADASER 2.0
- Smoking and Outcomes After Knee and Hip Arthroplasty: A Systematic Review
- The comparative risk of serious infections among rheumatoid arthritis patients starting or switching biological agents
- Updated consensus statement on biological agents for the treatment of rheumatic diseases, 2010
- Indirect comparisons of the efficacy of biological antirheumatic agents in rheumatoid arthritis in patients with an inadequate response to conventional disease-modifying antirheumatic drugs or to an anti-tumour necrosis factor agent: a meta-analysis
More in this TOC Section
Similar Articles

