


Article Figures & Tables
Figures
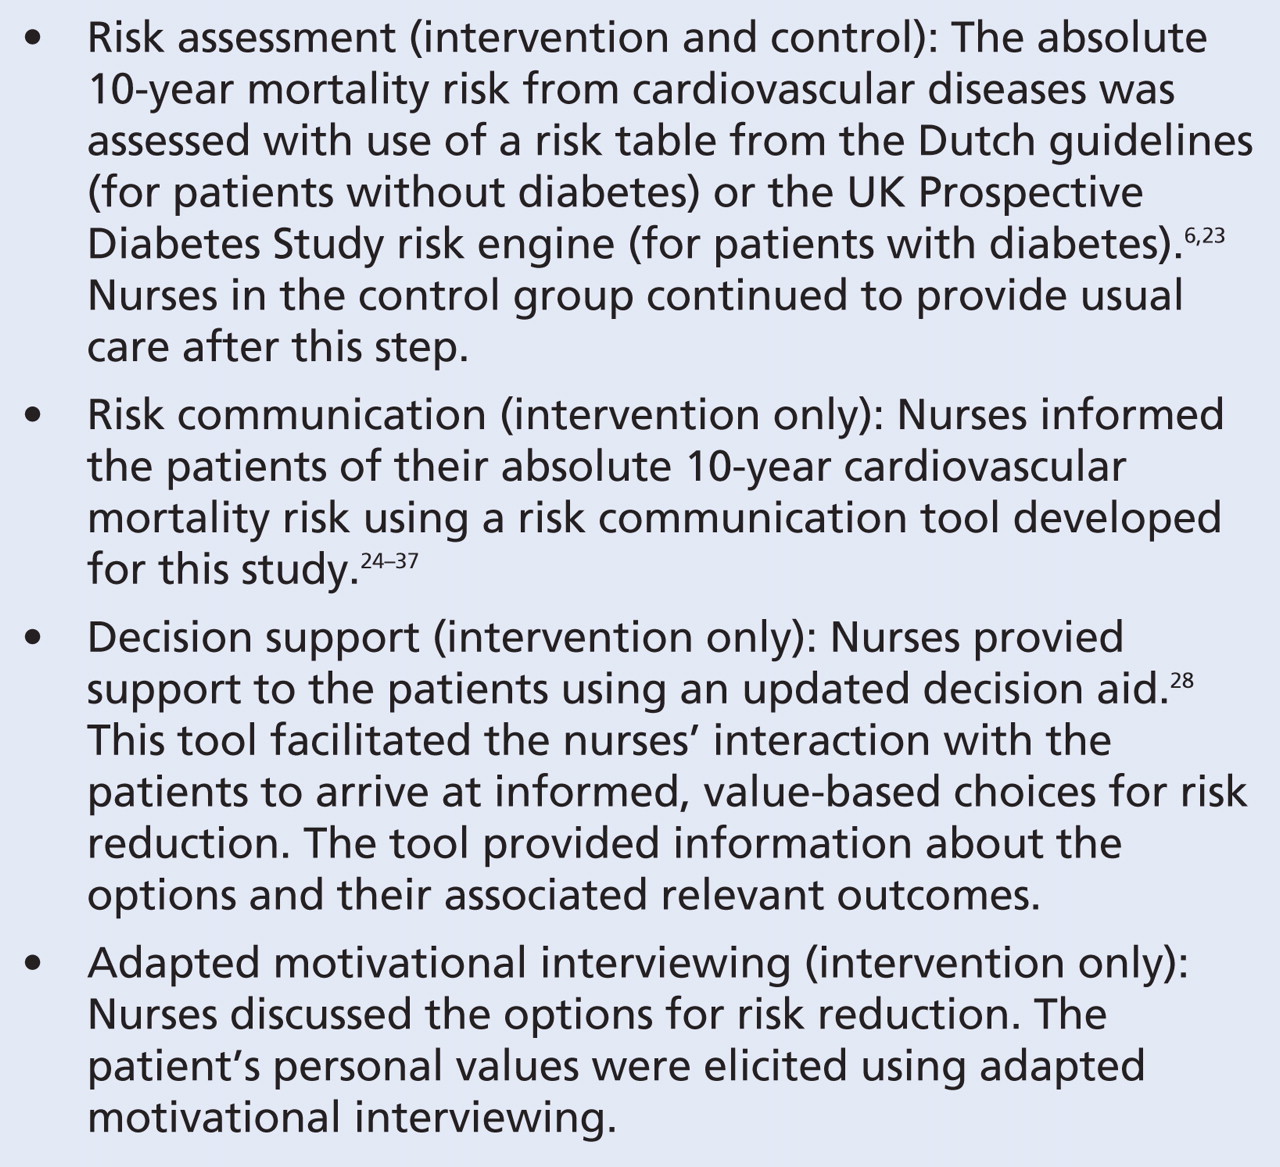
Box 1: Key features of the nurse-led intervention
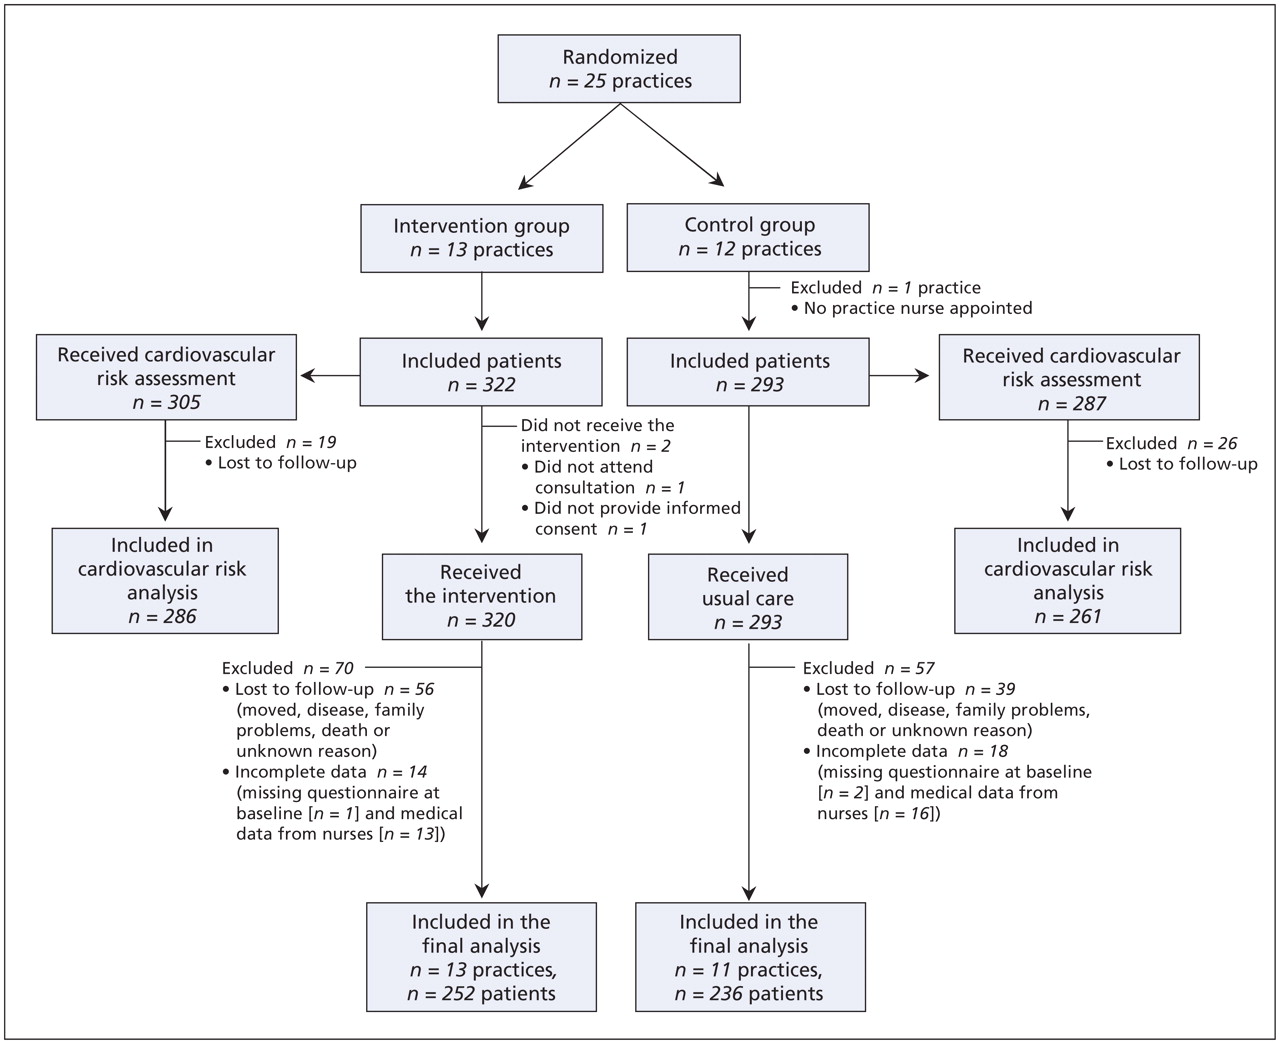
Figure 1: Flow diagram of the progress of clusters and individuals through the phases of the trial.
Figure 2: Multilevel logistic regression analysis of smoking (n = 114) and alcohol use (n = 48) at 1 year. Note: CI = confidence interval, ICC = intraclass correlation coefficient.


Tables
Table 1: Characteristics of the general practices, nurses and patients included in the study of nurse-led interventions for cardiovascular risk management

Table 2: Main outcomes at baseline and at 1 year


In this issue

Article tools
Respond to this article


Jump to section
Related Articles
Cited By...
- Multiple health behaviour change interventions for primary prevention of cardiovascular disease in primary care: systematic review and meta-analysis
- Developing an International Register of Clinical Prediction Rules for Use in Primary Care: A Descriptive Analysis
- Advanced practice nurses achieve results equal to or better than those of GPs in cardiovascular risk management in primary care
More in this TOC Section
Similar Articles

