


Article Figures & Tables
Figures
Figure 1: The performance–importance grid, as derived from a plot of the mean score for each question on the Canadian Health Care Evaluation Project (CANHELP) questionnaire for patients (measuring satisfaction with care) and the correlation coefficient for each question’s association with overall satisfaction from the patient’s point of view. Gridlines correspond to the median of the mean scores on each question (4.12) and the median of the correlation coefficients (0.29). Note: × = the plotted value; the number closest to the × is the corresponding CANHELP question number.

Tables
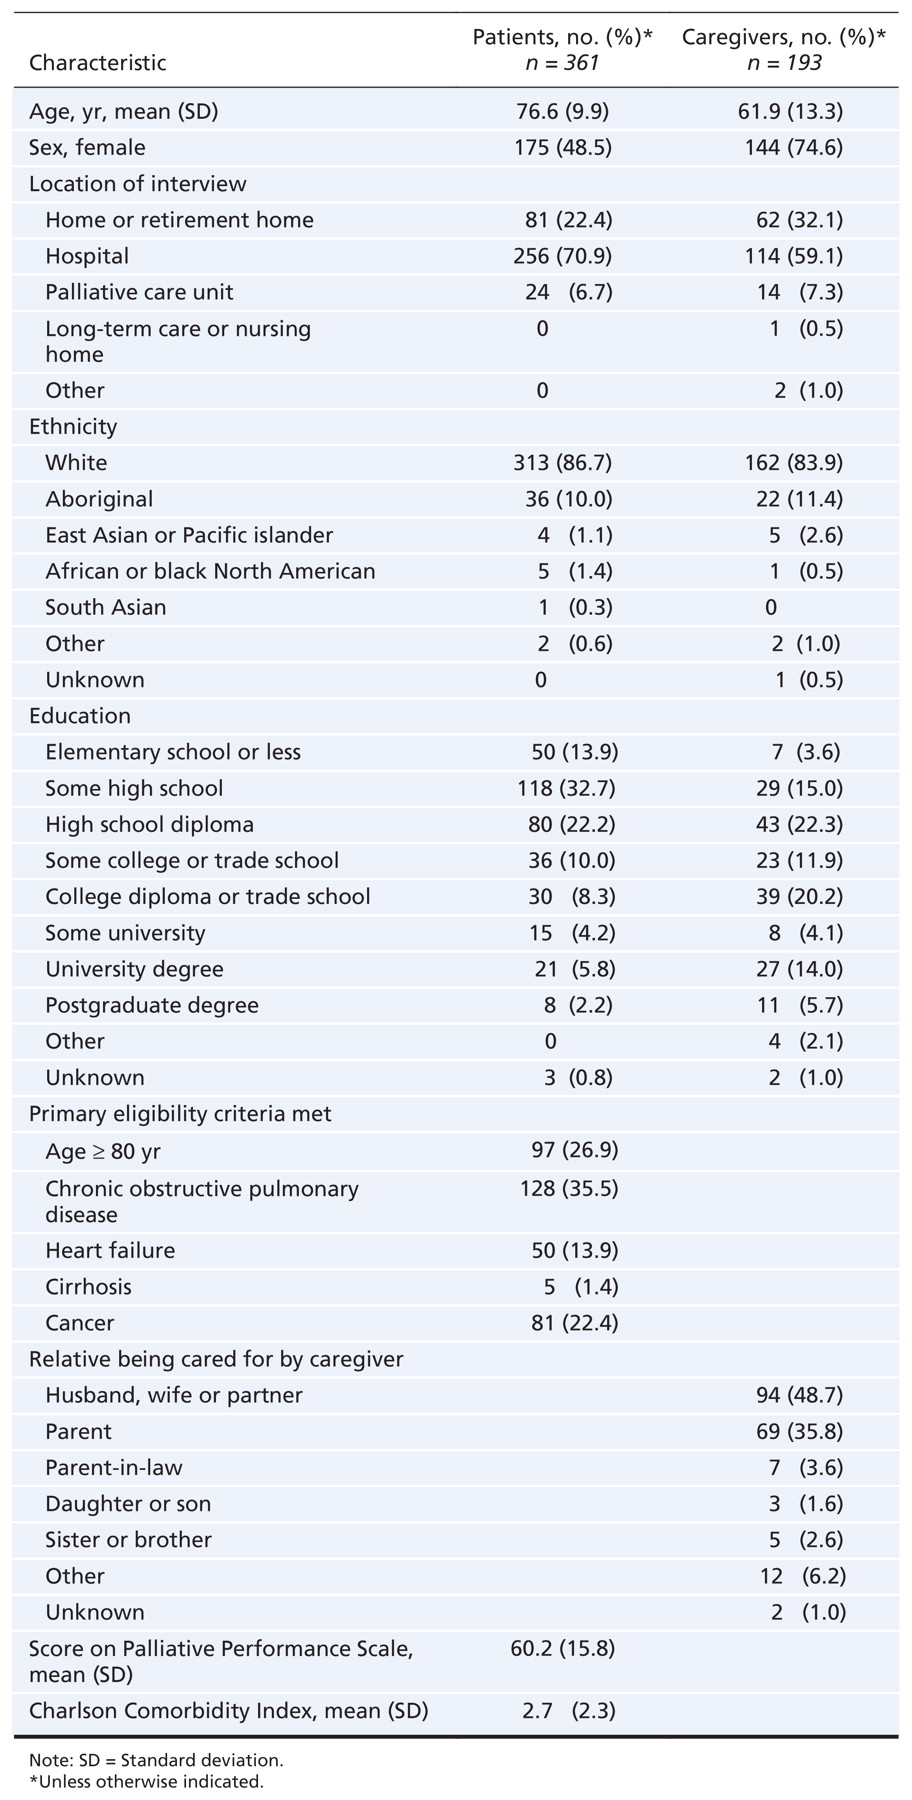
Table 1: Demographic characteristics of study participants

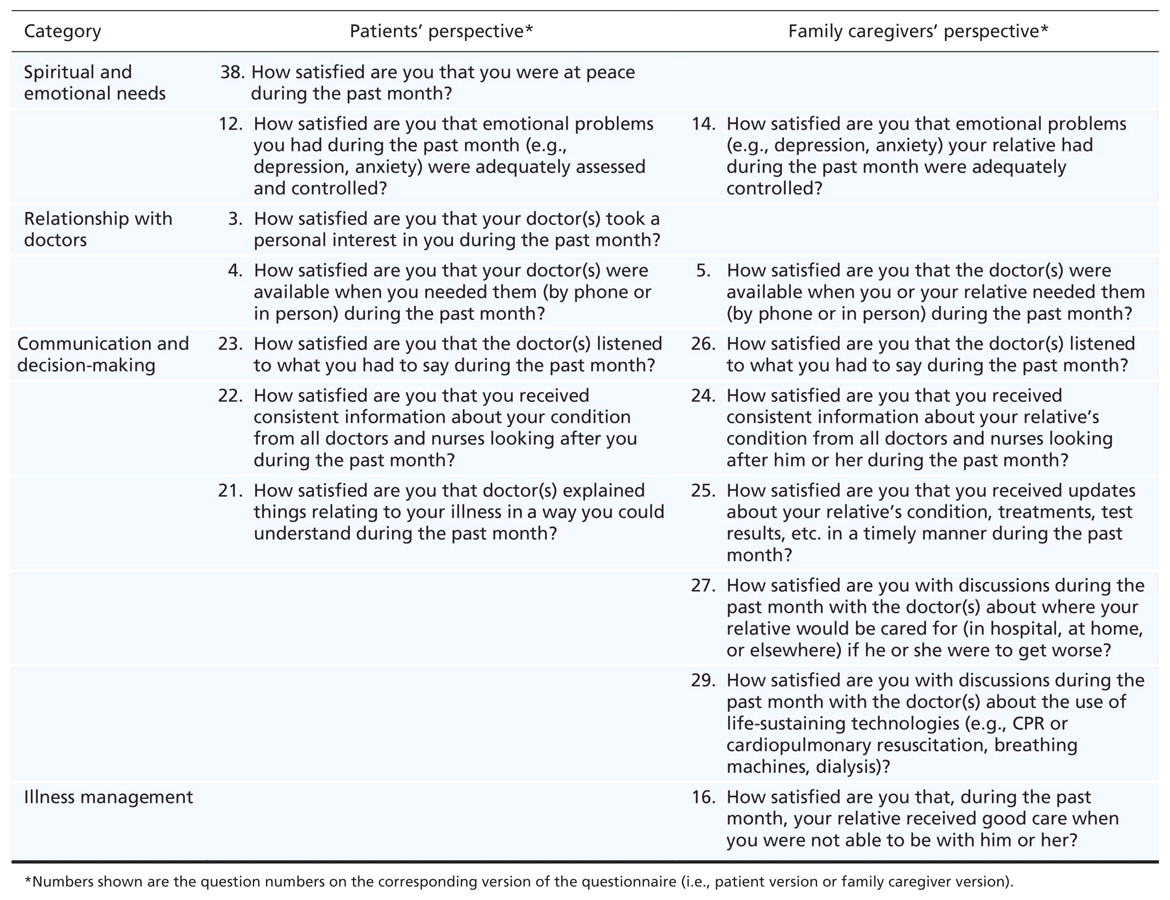
Table 2: Questionnaire items that were high in importance based on responses from patients and their families
In this issue

Article tools
Respond to this article


Jump to section
Related Articles
Cited By...
- Exploring the impact of compassion and leadership on patient safety and quality in healthcare systems: a narrative review
- Quality and safety in the literature: February 2024
- Quality of end-of-life communication in 2 high-risk ICU cohorts: a retrospective cohort study
- Building capacity for palliative care delivery in primary care settings: Mixed-methods evaluation of the INTEGRATE Project
- Association between Chinese or South Asian ethnicity and end-of-life care in Ontario, Canada
- Can a patient-directed video improve inpatient advance care planning? A prospective pre-post cohort study
- Improving hospital-based communication and decision-making about scope of treatment using a standard documentation tool
- The prevalence of medical error related to end-of-life communication in Canadian hospitals: results of a multicentre observational study
- Patient and healthcare perspectives on the importance and efficacy of addressing spiritual issues within an interdisciplinary bone marrow transplant clinic: a qualitative study
- Directives prealables: Sondage aupres de patients en soins primaires
- Advance directives: Survey of primary care patients
- What really matters in end-of-life discussions? Perspectives of patients in hospital with serious illness and their families
- 'Conditional candour' and 'knowing me': an interpretive description study on patient preferences for physician behaviours during end-of-life communication
- Just ask: discussing goals of care with patients in hospital with serious illness
- Enhancing the quality of end-of-life care in Canada
- Perspectives of patients, family caregivers and physicians about the use of opioids for refractory dyspnea in advanced chronic obstructive pulmonary disease
More in this TOC Section
Similar Articles

