


Article Figures & Tables
Figures
Figure 1: Age distribution of 3152 laboratory-confirmed cases of pandemic H1N1 influenza in the province of Ontario with onset of symptoms between Apr. 13 and June 20, 2009.
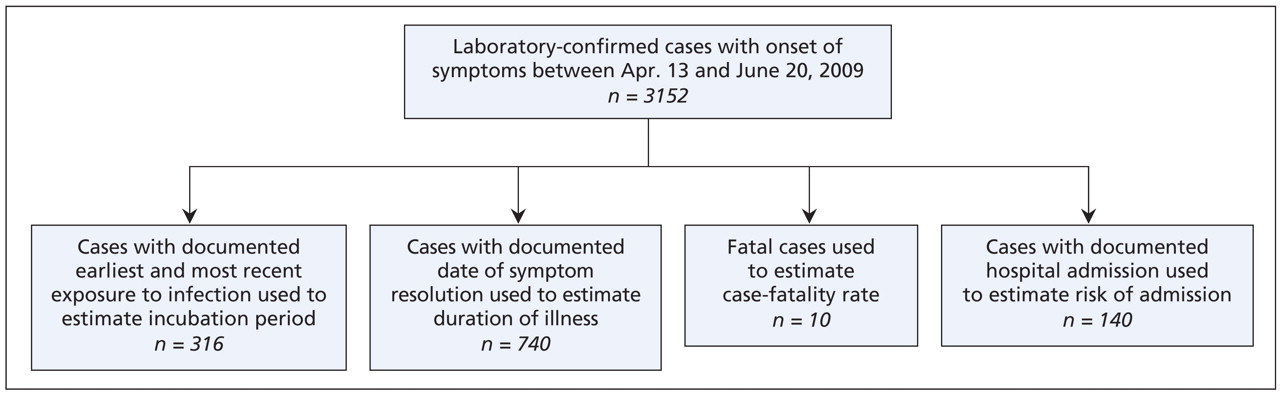
Figure 2: Breakdown of laboratory-confirmed cases of pandemic H1N1 influenza available for analysis.
Figure 3: Estimates of the incubation period (time from exposure to onset of symptoms) in 316 laboratory-confirmed cases of pandemic H1N1 influenza for whom these data were available. Estimates were calculated as the time between exposure date (midpoint of earliest and most recent exposure) and date of symptom onset. The blue curve represents the best-fit log-normal distribution of observed data.
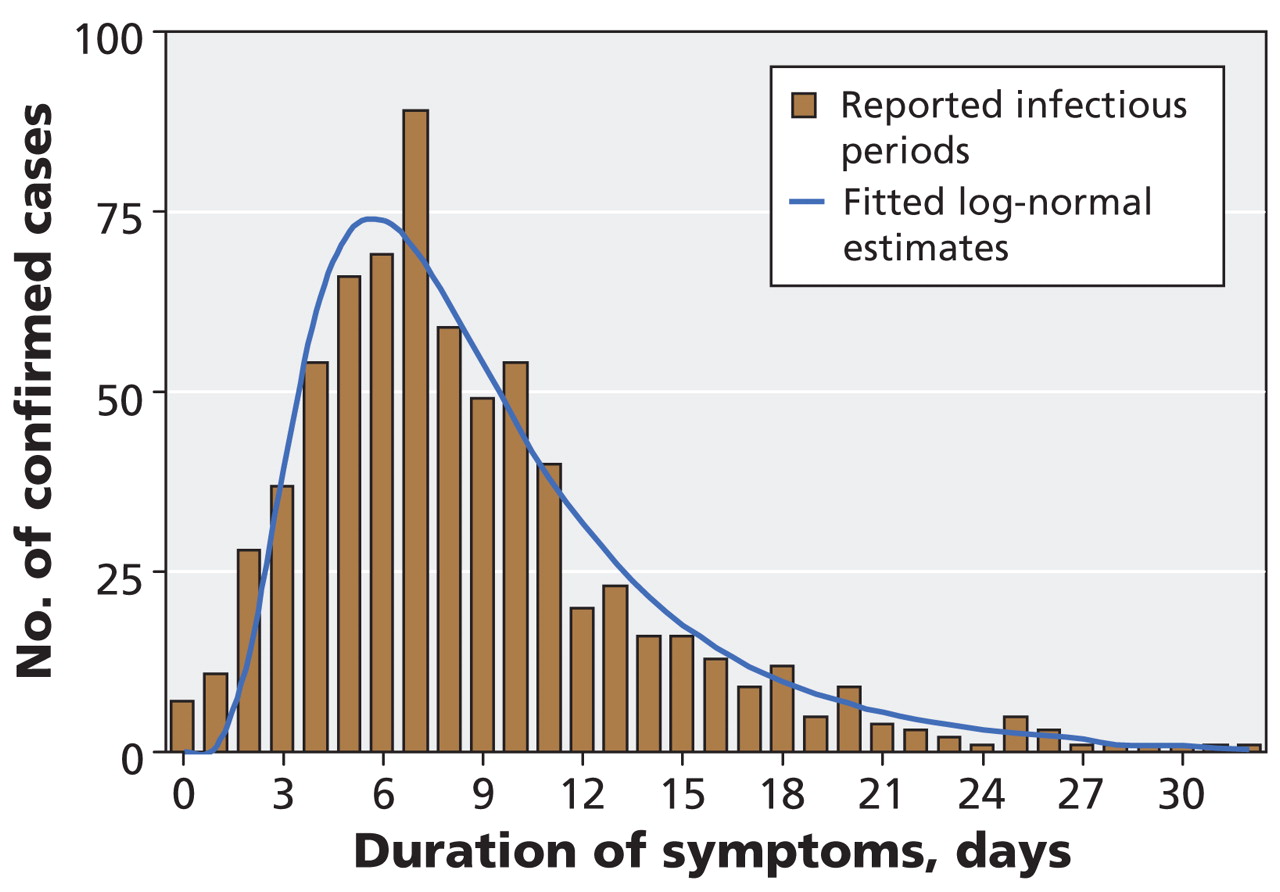
Figure 4: Estimates of the duration of symptoms (time from onset to resolution of symptoms) in 712 laboratory-confirmed cases of pandemic H1N1 influenza for whom these data were available. The blue curve represents the best-fit log-normal distribution of observed data.
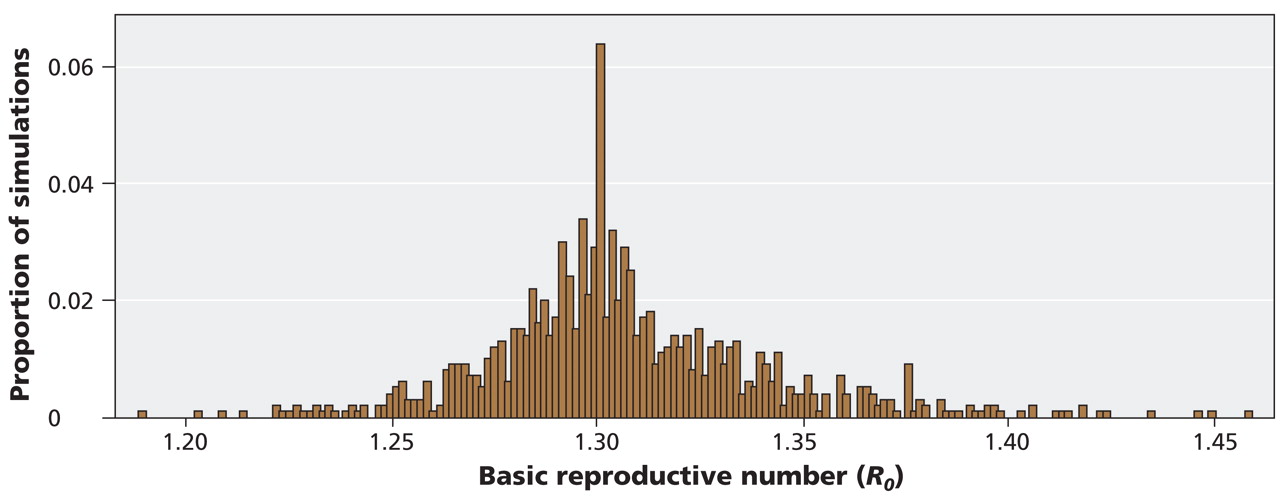
Figure 5: Estimates of the basic reproductive number (R0, number of new cases created by a single primary case in a susceptible population) in the province of Ontario during the wave of pandemic H1N1 influenza in the spring of 2009. Estimates were generated with the use of Markov Chain Monte Carlo simulation modelling. The mean estimate for R0 is 1.31 (95% credible interval 1.25–1.38).


Tables
Table 1: Risk of hospital admission among 3152 laboratory-confirmed cases of pandemic H1N1 influenza, by age group


In this issue

Article tools


Jump to section
Related Articles
Cited By...
- Tradeoff between speed and reproductive number in pathogen evolution
- Joint interactions with humans may pose a higher risk of zoonotic outbreaks than interactions with conspecifics among wildlife populations at human-wildlife interfaces
- Estimating the basic reproduction number at the beginning of an outbreak under incomplete data
- Early Mandated Social Distancing is a Strong Predictor of Reduction in Highest Number of New COVID-19 cases per Day within Various Geographic Regions
- The socio-economic determinants of the coronavirus disease (COVID-19) pandemic
- Disease persistence on temporal contact networks accounting for heterogeneous infectious periods
- Clinical and Epidemiological Features of 2009 Pandemic H1N1 Influenza Differ Slightly According to Seroprevalence Status During the Second Wave in the General Population in Mexico
- Transmissibility of the 2009 H1N1 pandemic in remote and isolated Canadian communities: a modelling study
- Prevalence of seroprotection against the pandemic (H1N1) virus after the 2009 pandemic
- Seasonality and H1N1
More in this TOC Section
Similar Articles
Collections

