


Article Figures & Tables
Figures
- Figure 1:
Flow diagram showing cohort selection for analysis of cascade of care on Dec. 31, 2018. *Members of the Kenora Chiefs Advisory were excluded from the analyses. †166 people had only inconclusive results from an HCV antibody test and no record of an HCV RNA test. ‡After complete case analysis, multivariable analysis (time from testing positive for HCV antibody to RNA test) was performed with 4771 people who underwent testing for HCV RNA after a positive result for HCV antibody. §After complete case analysis, multivariable analysis (time from testing positive for HCV RNA to treatment initiation) was performed with 2675 people who had a record of first HCV treatment after a positive result for HCV RNA. Note: HCV = hepatitis C virus, PHO = Public Health Ontario.
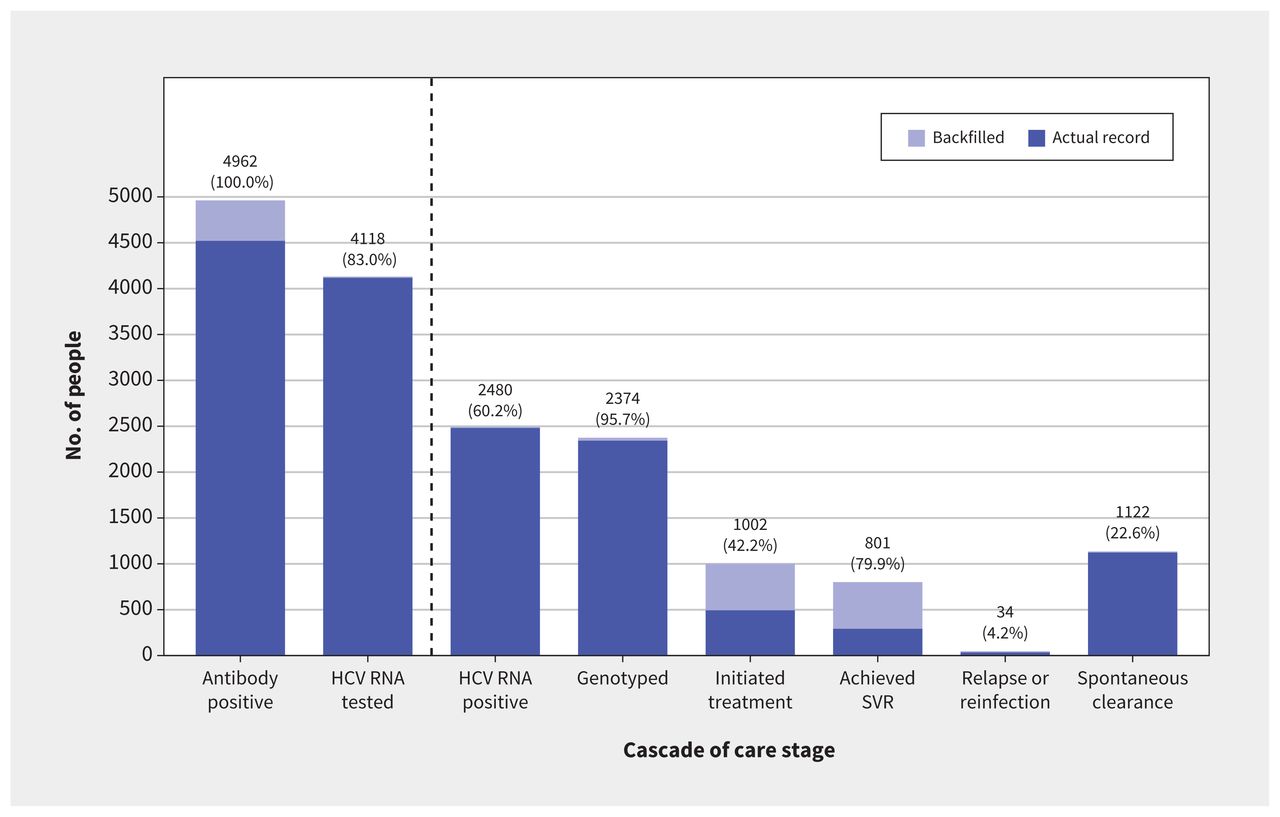
- Figure 2:
Cascade of care for hepatitis C virus (HCV) infection among Status First Nations peoples in Ontario on Dec. 31, 2018. The annotation above each bar describes the number of individuals and percentages relative to the previous stage. For the spontaneous clearance stage, the annotation above the bar describes the percentage of those who tested positive for HCV antibody. Note: SVR = sustained virologic response.

Tables
Care stage Definition Positive for HCV antibody Positive result for HCV antibody
Backfilled with people who had a result from an HCV RNA test and no previous result from an HCV antibody test
Tested for HCV RNA Tested for HCV RNA
Positive for HCV RNA Positive result for HCV RNA
Excluded people who spontaneously cleared infection, identified by
Negative result for HCV RNA test after testing positive for HCV antibody, with no record of treatment or positive test result for HCV RNA in between
Negative result for HCV RNA within a year after testing positive for HCV RNA, with no record of treatment in between
HCV genotyped HCV genotype result
Backfilled with people who were backfilled into the treatment initiated stage with no genotype record
HCV treatment initiated HCV treatment initiated
Backfilled with people who were backfilled into the achieved SVR stage†
Achieved SVR‡ For people with a record of an HCV treatment
If first dispensation record was for an IFN-based treatment, negative result for HCV RNA at least 40 weeks¶ after first date of treatment
If first dispensation record was for a DAA treatment, negative result from HCV RNA test at least 18 weeks** after first date of treatment
Backfilled with people who subsequently tested negative for HCV RNA more than a year after the date of their first positive result for HCV RNA, with no record of treatment
Note: DAA = direct-acting antiviral, IFN = interferon, SVR = sustained virologic response.
↵* At each stage, the individual must have achieved the stage on or before Dec. 31, 2018 (for main analysis), or Dec. 31, 2013 (for comparison analysis). Additional details regarding backfilled individuals and definition of spontaneous clearance can be found in Appendix 2, available at www.cmaj.ca/lookup/doi/10.1503/cmaj.220717/tab-related-content.
↵† For backfilled people, treatment date was assumed to be 6 months before SVR date.
↵‡ SVR date was assumed to be the date of the corresponding negative test result for HCV RNA.
↵¶ Interferon treatment duration was assumed to be an average of 24 weeks, with SVR measured 16 weeks after treatment completion.
↵** DAA treatment duration was assumed to be an average of 8 weeks, with SVR measured 10 weeks after treatment completion.
- Table 2:
Demographic and clinical characteristics of Status First Nations peoples in Ontario for each stage of the cascade of care for hepatitis C virus (HCV) infection on Dec. 31, 2018
Characteristic† No. (%) of participants* Positive for HCV antibody
n = 4962Tested for HCV RNA
n = 4118Positive for HCV RNA
n = 2480Genotyped
n = 2374Initiated treatment
n = 1002Achieved SVR‡
n = 801Backfilled 442 (8.9) 0 0 32 (1.3) 509 (50.8) 509 (63.5) Age at index date, yr, mean ± SD 35.3 ± 11.8 35.6 ± 11.9 35.5 ± 10.8 35.6 ± 10.8 37.5 ± 11.3 37.7 ± 11.2 Age at index date, yr, median (IQR) 34 (27–43) 34 (27–44) 34 (27–43) 35 (27–43) 37 (28–46) 38 (28–46) Age at index date, yr 0–24 926 (18.7) 777 (18.9) 427 (17.2) 404 (17.0) 139 (13.9) 104 (13.0) 25–29 828 (16.7) 669 (16.2) 429 (17.3) 413 (17.4) 149 (14.9) 124 (15.5) 30–34 766 (15.4) 623 (15.1) 395 (15.9) 370 (15.6) 141 (14.1) 109 (13.6) 35–39 720 (14.5) 566 (13.7) 348 (14.0) 331 (13.9) 136 (13.6) 102 (12.7) 40–44 640 (12.9) 533 (12.9) 350 (14.1) 339 (14.3) 153 (15.3) 121 (15.1) 45–49 464 (9.4) 407 (9.9) 250 (10.1) 246 (10.4) 129 (12.9) 114 (14.2) 50–54 305 (6.1) 265 (6.4) 154 (6.2) 148 (6.2) 76 (7.6) 66 (8.2) ≥ 55 313 (6.3) 278 (6.8) 127 (5.1) 123 (5.2) 79 (7.9) 61 (7.6) Birth cohort < 1945 34 (0.7) 28 (0.7) 15 (0.6) 14 (0.6) 9 (0.9) 6 (0.7) 1945–1964 1157 (23.3) 1002 (24.3) 611 (24.6) 600 (25.3) 347 (34.6) 289 (36.1) 1965–1975 1213 (24.4) 1004 (24.4) 632 (25.5) 612 (25.8) 260 (25.9) 208 (26.0) > 1975 2558 (51.6) 2084 (50.6) 1222 (49.3) 1148 (48.4) 386 (38.5) 298 (37.2) Sex Female 2348 (47.3) 1974 (47.9) 1054 (42.5) 997 (42.0) 444 (44.3) 370 (46.2) Male 2614 (52.7) 2144 (52.1) 1426 (57.5) 1377 (58.0) 558 (55.7) 431 (53.8) Urbanicity at index date Missing or unknown 53 (1.1) 32 (0.8) 19 (0.8) 18 (0.8) 6 (0.6) ≤ 5 Urban 3244 (65.4) 2632 (63.9) 1662 (67.0) 1598 (67.3) 734 (73.3) 579 (72.3) Rural 1665 (33.6) 1454 (35.3) 799 (32.2) 758 (31.9) 262 (26.1) ≤ 221 Community status at index date§ Missing or unknown 281 (5.7) 227 (5.5) 157 (6.3) 155 (6.5) 83 (8.3) 65 (8.1) Outside of First Nations community 3583 (72.2) 2920 (70.9) 1795 (72.4) 1718 (72.4) 750 (74.9) 586 (73.2) Within First Nations community 1098 (22.1) 971 (23.6) 528 (21.3) 501 (21.1) 169 (16.9) 150 (18.7) LHIN at index date Missing or unknown 30 (0.6) 16 (0.4) 11 (0.4) 11 (0.5) ≤ 5 ≤ 5 1. Erie St. Clair 328 (6.6) 249 (6.0) 148 (6.0) 139 (5.9) ≤ 5 35 (4.4) 2. South West 376 (7.6) 310 (7.5) 185 (7.5) 174 (7.3) 80 (8.0) 65 (8.1) 3. Waterloo Wellington 56 (1.1) 50 (1.2) 29 (1.2) 27 (1.1) 15 (1.5) 12 (1.5) 4. Hamilton Niagara Haldimand Brant 474 (9.6) 387 (9.4) 238 (9.6) 229 (9.6) 98 (9.8) 81 (10.1) 5. Central West 33 (0.7) 28 (0.7) 15 (0.6) 14 (0.6) 9 (0.9) 7 (0.9) 6. Mississauga Halton 28 (0.6) 22 (0.5) 12 (0.5) 10 (0.4) ≤ 5 ≤ 5 7. Toronto Central 335 (6.8) 271 (6.6) 167 (6.7) 163 (6.9) 88 (8.8) 66 (8.2) 8. Central 55 (1.1) 50 (1.2) 27 (1.1) 27 (1.1) 13 (1.3) 11 (1.4) 9. Central East 138 (2.8) 110 (2.7) 69 (2.8) 68 (2.9) 40 (4.0) 32 (4.0) 10. South East 108 (2.2) 88 (2.1) 57 (2.3) 56 (2.4) 31 (3.1) 25 (3.1) 11. Champlain 184 (3.7) 142 (3.4) 95 (3.8) 91 (3.8) 32 (3.2) 23 (2.9) 12. North Simcoe Muskoka 106 (2.1) 82 (2.0) 52 (2.1) 48 (2.0) 29 (2.9) 23 (2.9) 13. North East 1023 (20.6) 845 (20.5) 530 (21.4) 509 (21.4) 202 (20.2) 151 (18.9) 14. North West 1688 (34.0) 1468 (35.6) 845 (34.1) 808 (34.0) 310 (30.9) 267 (33.3) Comorbidities¶ ADG score 1 year before index date, mean ± SD 5.1 ± 3.8 5.1 ± 3.7 5.1 ± 3.7 5.1 ± 3.7 5.2 ± 3.7 5.1 ± 3.6 ADG score 1 year before index date, median (IQR) 4 (2–8) 4 (2–8) 5 (2–8) 5 (2–8) 5 (2–8) 5 (2–7) Number of ADG categories 1 year before index date 0 387 (7.7) 323 (7.8) 200 (8.1) 193 (8.1) 81 (8.1) 65 (8.1) 1–4 2100 (42.3) 1759 (42.7) 1023 (41.3) 974 (41.0) 393 (39.2) 314 (39.2) 5–9 1806 (36.4) 1500 (36.4) 945 (38.1) 908 (38.2) 399 (39.8) 325 (40.6) ≥ 10 674 (13.6) 536 (13.0) 312 (12.6) 299 (12.5) 129 (12.9) 97 (12.1) Mental health records Substance use and addictive disorders Before index date 3728 (75.1) 3069 (74.5) 1918 (77.3) 1825 (76.9) 743 (74.2) 567 (70.8) Before Dec. 31, 2018 4233 (85.3) 3500 (85.0) 2189 (88.3) 2094 (88.2) 858 (85.6) 667 (83.3) Mood disorders Before index date 1890 (38.1) 1559 (37.9) 931 (37.5) 891 (37.5) 365 (36.4) 281 (35.1) Before Dec. 31, 2018 2566 (51.7) 2138 (51.9) 1303 (52.5) 1254 (52.8) 539 (53.8) 425 (53.1) Personality disorders Before index date 821 (16.5) 663 (16.1) 428 (17.3) 408 (17.2) 163 (16.3) 121 (15.1) Before Dec. 31, 2018 1099 (22.1) 897 (21.8) 599 (24.2) 574 (24.2) 232 (23.2) 181 (22.6) Schizophrenia spectrum and other psychotic disorders Before index date 619 (12.5) 494 (12.0) 331 (13.3) 314 (13.2) 123 (12.3) 83 (10.4) Before Dec. 31, 2018 992 (20.0) 809 (19.6) 551 (22.2) 531 (22.4) 213 (21.3) 152 (19.0) Anxiety disorders Before index date 3731 (75.2) 3107 (75.4) 1914 (77.2) 1833 (77.2) 796 (79.4) 621 (77.5) Before Dec. 31, 2018 4144 (83.5) 3447 (83.7) 2121 (85.5) 2035 (85.7) 875 (87.3) 691 (86.3) Trauma or stressor-related disorders Before index date 1343 (27.1) 1122 (27.2) 712 (28.7) 685 (28.9) 257 (25.6) 198 (24.7) Before Dec. 31, 2018 1849 (37.3) 1545 (37.5) 1000 (40.3) 969 (40.8) 379 (37.8) 297 (37.1) Deliberate self harm Before index date 836 (16.8) 675 (16.4) 436 (17.6) 411 (17.3) 152 (15.2) 113 (14.1) Before Dec. 31, 2018 1245 (25.1) 1025 (24.9) 677 (27.3) 644 (27.1) 236 (23.6) 179 (22.3) Disease-specific records Genotype of HCV infection Genotype 1 1711 (34.5) 1711 (41.5) 1592 (64.2) 1592 (67.1) 665 (66.4) 533 (66.5) Genotype 2 162 (3.3) 162 (3.9) 149 (6.0) 149 (6.3) 70 (7.0) 62 (7.7) Genotype 3 600 (12.1) 600 (14.6) 559 (22.5) 559 (23.5) 217 (21.7) 164 (20.5) Genotype 4 ≤ 5 ≤ 5 ≤ 5 ≤ 5 ≤ 5 ≤ 5 Multiple genotypes ≤ 19 ≤ 19 ≤ 16 ≤ 16 ≤ 6 ≤ 5 Missing or unknown** 2469 (49.8) 1625 (39.5) 163 (6.6) 57 (2.4) 43 (4.3) 36 (4.5) HBV Before index date 52 (1.0) 42 (1.0) 26 (1.0) 26 (1.1) 14 (1.4) 13 (1.6) Before Dec. 31, 2018 119 (2.4) 103 (2.5) 64 (2.6) 64 (2.7) 32 (3.2) 27 (3.4) HIV Before index date 94 (1.9) 89 (2.2) 45 (1.8) 45 (1.9) 29 (2.9) 22 (2.7) Before Dec. 31, 2018 187 (3.8) 178 (4.3) 110 (4.4) 109 (4.6) 47 (4.7) 32 (4.0) Cirrhosis Before index date 89 (1.8) 79 (1.9) 50 (2.0) 50 (2.1) 33 (3.3) 31 (3.9) Before Dec. 31, 2018 240 (4.8) 224 (5.4) 173 (7.0) 173 (7.3) 119 (11.9) 105 (13.1) Decompensated cirrhosis Before index date 65 (1.3) 58 (1.4) 36 (1.5) 36 (1.5) 24 (2.4) 22 (2.7) Before Dec. 31, 2018 139 (2.8) 130 (3.2) 96 (3.9) 96 (4.0) 67 (6.7) 59 (7.4) Hepatocellular carcinoma Before index date 0 (0.0) 0 (0.0) 0 (0.0) 0 (0.0) 0 (0.0) 0 (0.0) Before Dec. 31, 2018 15 (0.3) 14 (0.3) 14 (0.6) 14 (0.6) 9 (0.9) 9 (1.1) Liver transplant Before index date ≤ 5 ≤ 5 ≤ 5 ≤ 5 0 (0.0) 0 (0.0) Before Dec. 31, 2018 18 (0.4) 18 (0.4) 12 (0.5) 12 (0.5) 10 (1.0) 9 (1.1) Note: ADG = aggregated diagnosis groups, HBV = hepatitis B virus, IQR = interquartile range, LHIN = Local Health Integration Network, SD = standard deviation, SVR = sustained virologic response.
↵* Unless indicated otherwise.
↵† Index date corresponded to the earliest positive record date (positive for HCV antibody, positive for HCV RNA, genotype or treatment dispensation record). For people with only RNA tests on record, index date was assigned as earliest RNA test date. Cell sizes ≤ 5 cannot be reported or able to be recalculated to comply with ICES privacy rules.
↵‡ For certain people, we were unable to check for SVR owing to minimal post-treatment follow-up time.
↵§ Includes people for whom this variable indicated residence outside of Ontario during the year of assessment. Ontario residence for the initial exclusion criteria was determined using the Registered Persons Database rather than the residence within or outside of the First Nations community database.
↵¶ ADG score was derived using the John Hopkins ACG system.
↵** Includes people with an indeterminate genotype result.
- Table 3:
Factors associated with Status First Nations peoples who underwent testing for hepatitis C virus (HCV) RNA after a positive HCV antibody test (n = 4771)*
Variable Unadjusted* hazard ratio (95% CI) Adjusted hazard ratio (95% CI) Sex Male Ref. Ref. Female 1.07 (1.01–1.15) 1.12 (1.05–1.19) Age category (RNA testing ≤ 1 yr after testing positive for antibody)*, yr 0–20 0.93 (0.78–1.11) 0.94 (0.79–1.13) 21–40 Ref. Ref. 41–60 1.15 (1.06–1.25) 1.30 (1.19–1.41) ≥ 61 1.68 (1.36–2.06) 1.47 (1.18–1.81) Age category (RNA testing > 1 yr after testing positive for antibody)*, yr 0–20 1.05 (0.82–1.34) 1.11 (0.86–1.42) 21–40 Ref. Ref. 41–60 0.96 (0.84–1.09) 1.03 (0.90–1.17) ≥ 61 0.97 (0.55–1.72) 1.06 (0.60–1.88) Urbanicity of residence Urban Ref. Ref. Rural 1.43 (1.34–1.53) 1.20 (1.10–1.30) Community residence Outside of First Nations community Ref. Ref. Within First Nations community 1.54 (1.42–1.66) 1.19 (1.08–1.31) Comorbidities† ADG score, 1 year before index date 0.98 (0.97–0.99) 0.99 (0.98–0.99) Coinfection with HBV or HIV No record Ref. Ref. Record before index date 0.96 (0.79–1.17) 1.09 (0.89–1.33) Substance use or addictive disorders (RNA testing ≤ 1 yr after testing positive for antibody)* No record Ref. Ref. Record before index date 0.91 (0.84–1.00) 0.88 (0.80–0.96) Substance use or addictive disorders (RNA testing > 1 yr after testing positive for antibody)* No record Ref. Ref. Record before index date 1.36 (1.18–1.58) 1.38 (1.18–1.60) Treatment era Index date before Dec. 31, 2013 (pre-DAA era) Ref. Ref. Index date after Dec. 31, 2013 (post-DAA era) 2.06 (1.92–2.21) 1.99 (1.85–2.15) Note: ADG = aggregated diagnosis groups, CI = confidence interval, DAA = direct-acting antiviral, HBV = hepatitis B virus, Ref. = reference.
↵* Model was run with people who had an index date that corresponded to their positive antibody test. Those who did not have an HCV RNA test were censored at date of death, 10 years after date of last contact with the health care system or on Dec. 31, 2018, whichever occurred first. The model was run with 4771 people and consisted of 3753 events and 1018 individuals censored. In total, the model had 14 degrees of freedom. The proportional hazards assumption was checked for each model covariate using time-to-event curves and weighted Schoenfeld residuals (at a threshold of p < 0.05). For covariates that violated the assumption, piecewise regression was used where the time interval was split into ≤ 1 year and > 1 year after testing positive for HCV antibody. For covariates that violated the proportional hazards assumption, univariate analyses consisted of the covariate run piecewise over both time intervals.
↵† ADG score was derived using the John Hopkins ACG System.
- Table 4:
Factors associated with Status First Nations peoples who had a record of first treatment dispensation for hepatitis C virus (HCV) infection after a positive HCV RNA test (n = 2675)*
Variable Unadjusted hazard ratio (95% CI) Adjusted hazard ratio (95% CI) Sex Male Ref. Ref. Female 1.10 (0.97–1.25) 1.15 (1.01–1.31) Age, yr 0–20 1.11 (0.80–1.53) 1.08 (0.78–1.50) 21–40 Ref. Ref. 41–60 1.18 (1.03–1.34) 1.32 (1.15–1.50) ≥ 61 2.58 (1.78–3.76) 2.62 (1.80–3.82) Urbanicity of residence Urban Ref. Ref. Rural 0.98 (0.85–1.13) 0.85 (0.72–1.01) Community residence Outside of First Nations community Ref. Ref. Within First Nations community 1.13 (0.96–1.33) 1.03 (0.85–1.25) Comorbidities† ADG score, 1 year before index date 0.99 (0.97–1.01) 0.99 (0.97–1.01) Coinfection with HBV or HIV No record Ref. Ref. Record before index date 0.96 (0.69–1.33) 1.00 (0.72–1.40) Substance use or addictive disorders No record Ref. Ref. Record before index date 1.15 (0.99–1.33) 1.09 (0.94–1.28) Treatment era Index date before Dec. 31, 2013 (pre-DAA era) Ref. Ref. Index date after Dec. 31, 2013 (post-DAA era) 2.59 (2.20–3.05) 2.71 (2.29–3.22) Note: ADG = aggregated diagnosis groups, CI = confidence interval, DAA = direct-acting antiviral, HBV = hepatitis B virus, Ref. = reference.
↵* Model was run only with people with a positive RNA test. Those who did not initiate treatment were censored at date of death, 10 years after date of last contact with the health care system or on Dec. 31, 2018, whichever occurred first. The model was run with 2675 people and consisted of 973 events (including backfilled treatment people) and 1702 people censored. In total, the model had 10 degrees of freedom. The proportional hazards assumption was checked for each model covariate using time-to-event curves and weighted Schoenfeld residuals (at a threshold of p < 0.05) and no variables violated the assumption.
↵† ADG score was derived using the John Hopkins ACG system.
In this issue
Article tools


Jump to section
Related Articles
Cited By...
- No citing articles found.
More in this TOC Section
Similar Articles
Collections

