


Article Figures & Tables
Figures
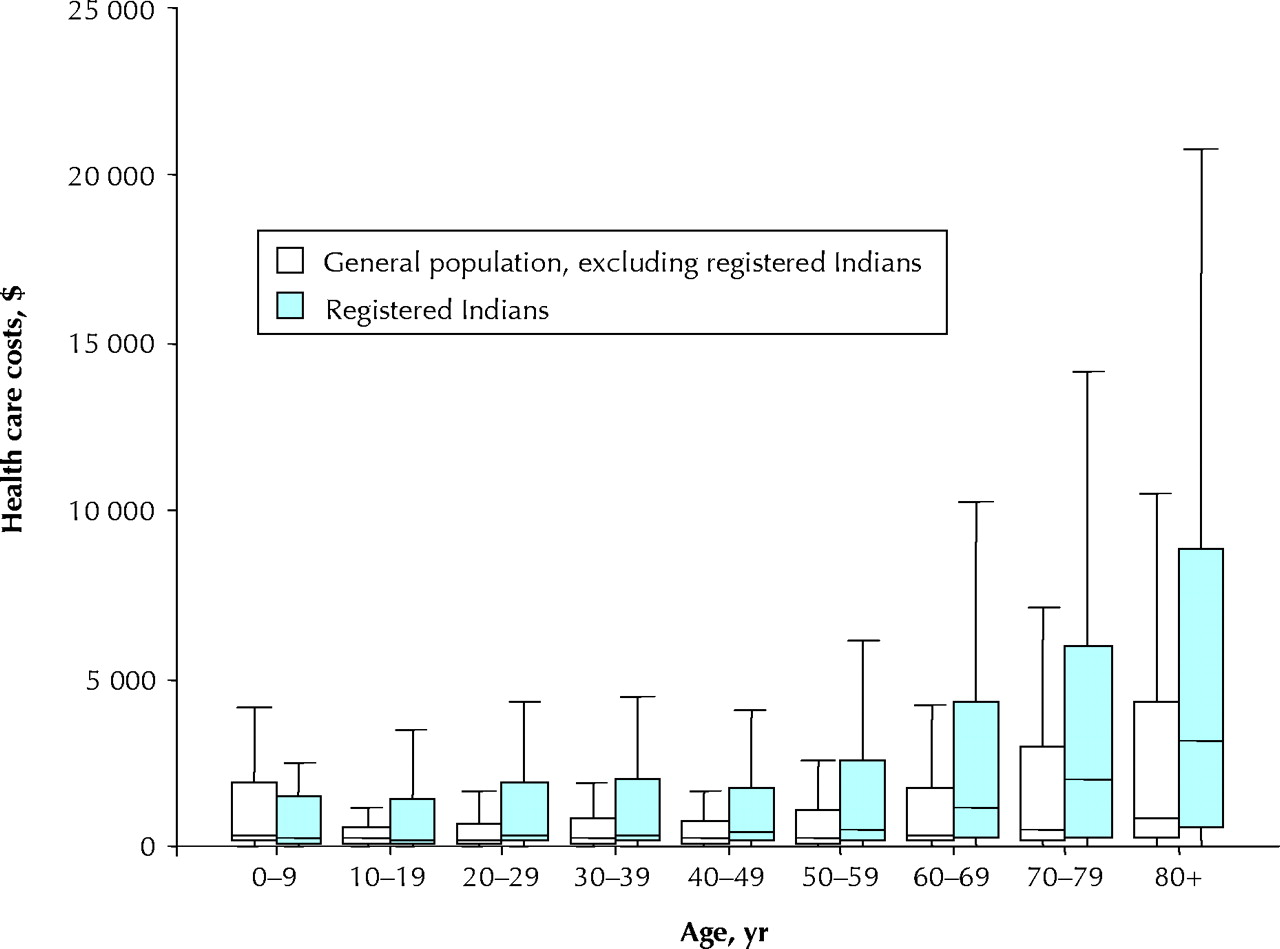
Fig. 1: Health care expenditures according to age and population status for Saskatchewan residents identified as having diabetes mellitus in 1996. The lower and upper portions of the bars represent the 25th and 75th percentiles, respectively; the midline represents the median; the projecting lines represent the most extreme values in the data set that were not more than 1.5 times the height of the bar beyond either quartile.
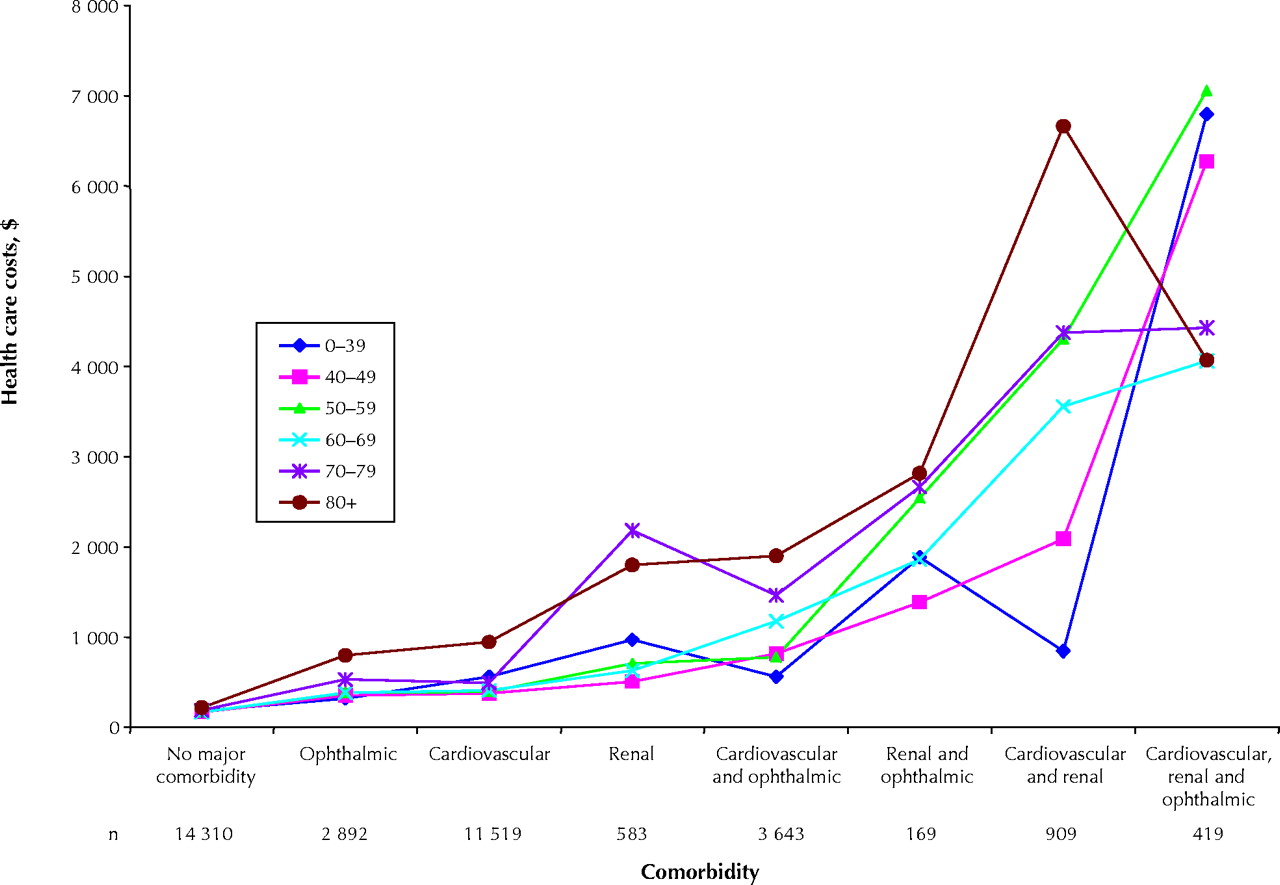
Fig. 2A (top): Median health care expenditures for the general population by comorbidity and age.
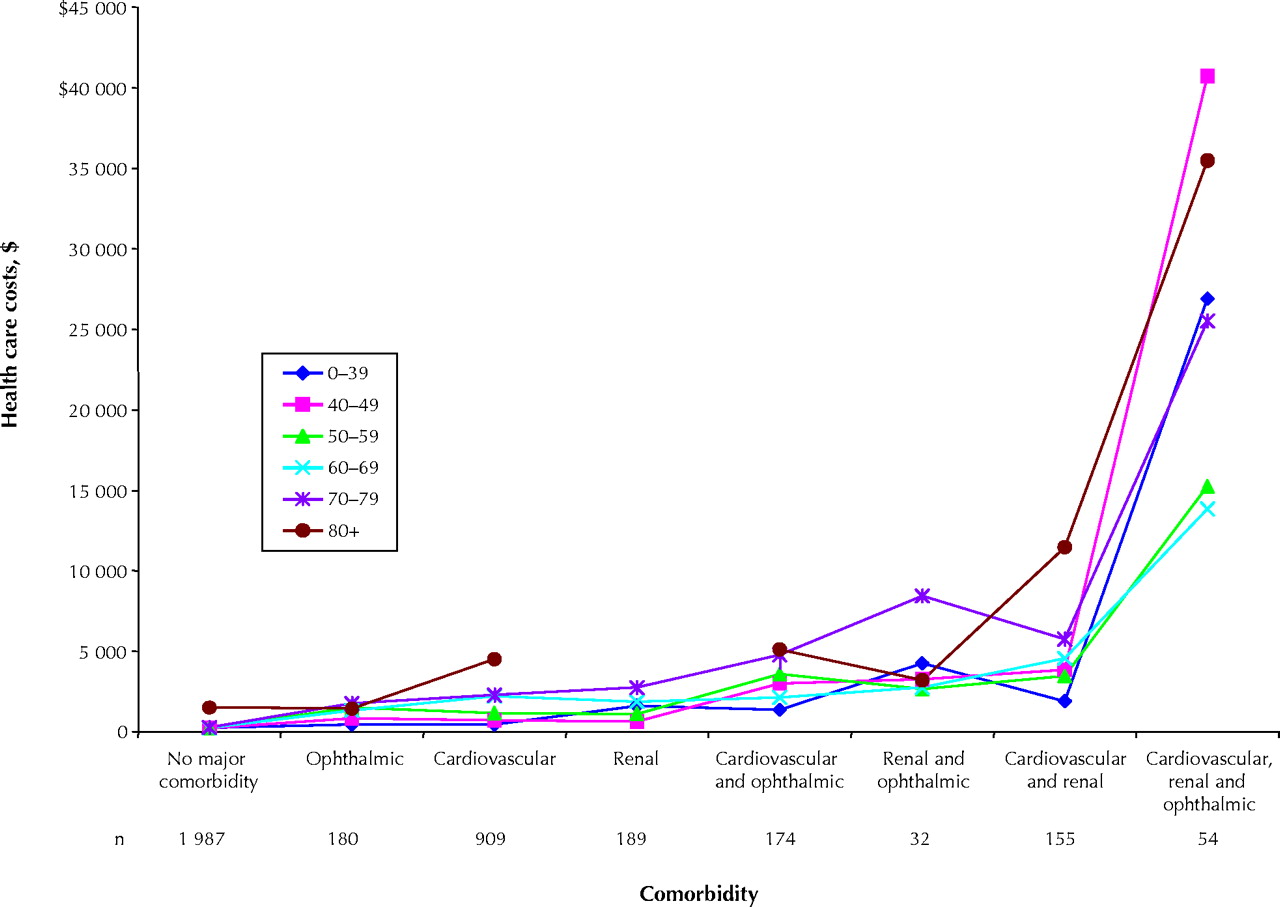
Fig. 2B (bottom): Median health care expenditures for the registered Indian group by comorbidity and age. The scale is different because of the greater expenditures in this subpopulation.
Fig. 2A (top): Median health care expenditures for the general population by comorbidity and age.
Fig. 2B (bottom): Median health care expenditures for the registered Indian group by comorbidity and age. The scale is different because of the greater expenditures in this subpopulation.

Tables
Table 1.

Table 2.
Table 3.
Appendix 1.
Appendix 2.


In this issue

Article tools


Jump to section
Related Articles
Cited By...
- Association of diabetes with frequency and cost of hospital admissions: a retrospective cohort study
- Association Between Modifiable Risk Factors and Pharmaceutical Expenditures Among Adults With Atherosclerotic Cardiovascular Disease in the United States: 2012-2013 Medical Expenditures Panel Survey
- Lifetime risk of diabetes among First Nations and non-First Nations people
- Identifying strategies to improve diabetes care in Alberta, Canada, using the knowledge-to-action cycle
- Health Care Costs in People With Diabetes and Their Association With Glycemic Control and Kidney Function
- Use of chronic disease management programs for diabetes: In Alberta's primary care networks
- Enrolment in primary care networks: impact on outcomes and processes of care for patients with diabetes
- Effect of Adding Pharmacists to Primary Care Teams on Blood Pressure Control in Patients With Type 2 Diabetes: A randomized controlled trial
- Peer status in school and adult disease risk: a 30-year follow-up study of disease-specific morbidity in a Stockholm cohort
- Exercise Training for Type 2 Diabetes Mellitus: Impact on Cardiovascular Risk: A Scientific Statement From the American Heart Association
- Health Care Use and Costs in the Decade After Identification of Type 1 and Type 2 Diabetes: A population-based study.
- Restless Legs Syndrome and Quality of Sleep in Type 2 Diabetes
- History of Depression Increases Risk of Type 2 Diabetes in Younger Adults
More in this TOC Section
Similar Articles

